Back to Vision
YOU ARE HERE:Research & Innovation
SCIENCE & INNOVATION

Don't Just Study the Problem.
Build a Better Solution.

The Conservation & Discovery Center is envisioned as a place where field observations from the Indian River Lagoon can connect directly with research, engineering, environmental data, prototype development and real-world testing.

A problem discovered by Project Lagoon could become a research question, a new design, a prototype, a field test — and eventually a conservation solution capable of being used far beyond one location.
DISCOVER→RESEARCH→INVENT→BUILD→DEPLOY→MEASURE→RESTORE
FOLLOW AN IDEA
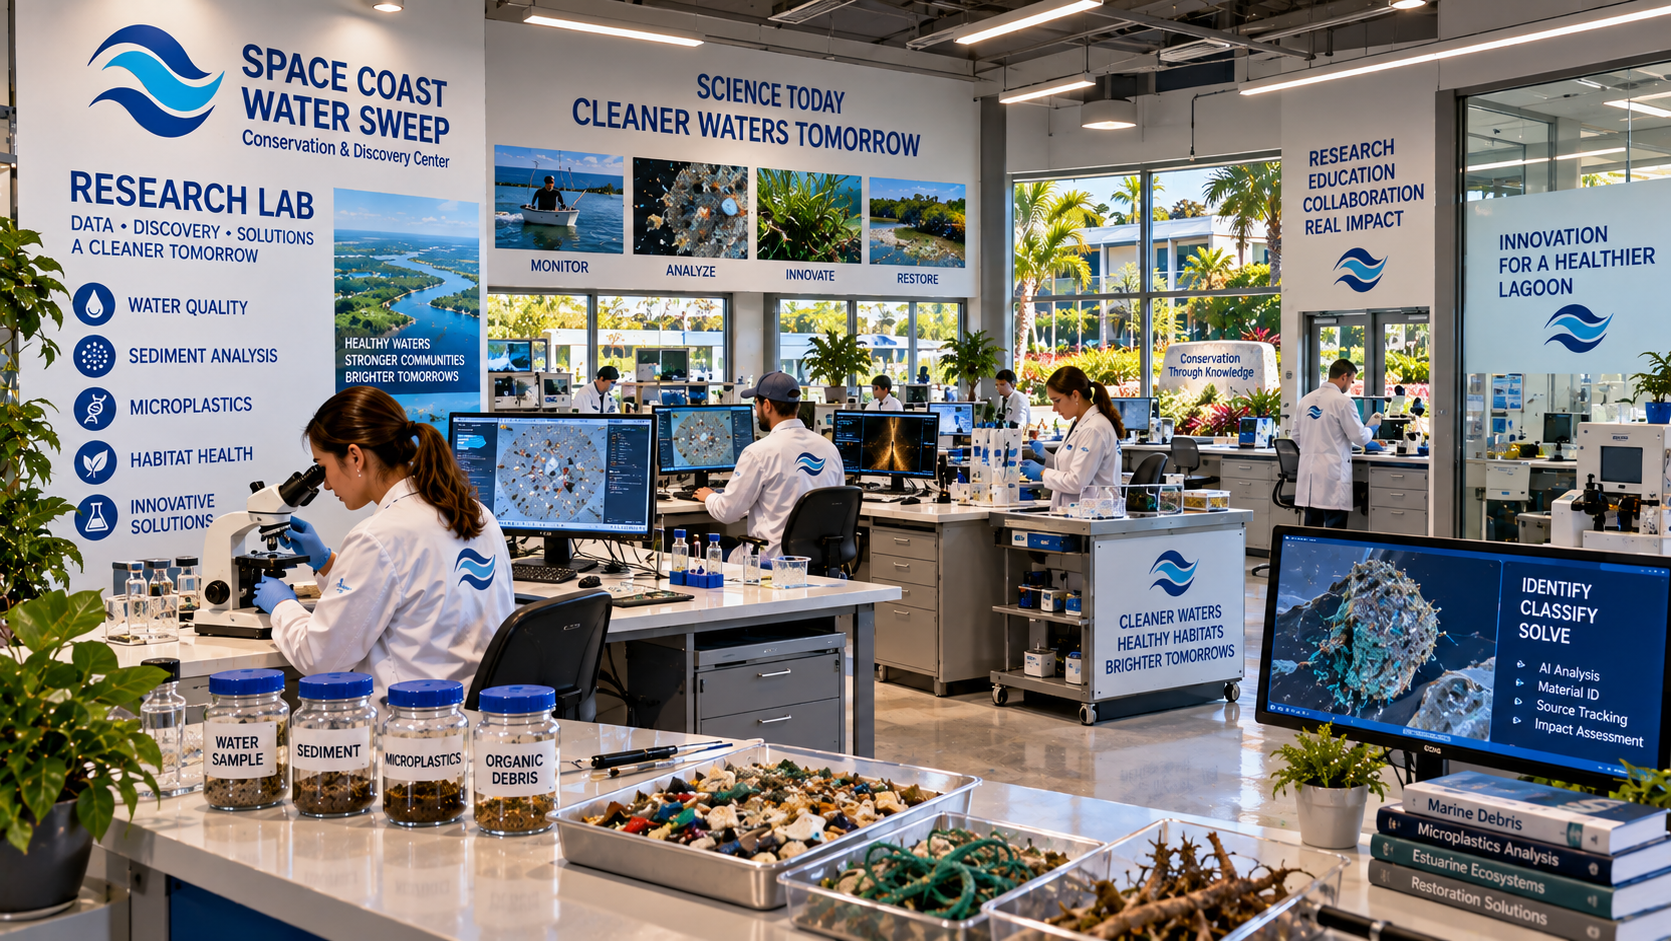
Conceptual rendering of the Science & Innovation research lab at the Space Coast Water Sweep Conservation & Discovery Center
01 — DISCOVER

The Best Research Questions May Start Out on the Water.

Science and innovation begin with actual environmental observations. Not every observation automatically becomes a research project — but real-world experience can surface questions worth investigating.

EXAMPLES OF QUESTIONS:

  • Why does debris repeatedly collect here?
  • How does a material behave after long-term exposure to Lagoon conditions?
  • Could a different habitat structure perform better?
  • Can a sensor be redesigned to make field monitoring easier?
  • Can recovered material be safely reused for another conservation purpose?
Project Lagoon
Hidden Waters
Field crews
Sonar
ROV observations
Drone observations
Water monitoring
Debris observations
Restoration monitoring
Community observations
Historical environmental data
University or research questions
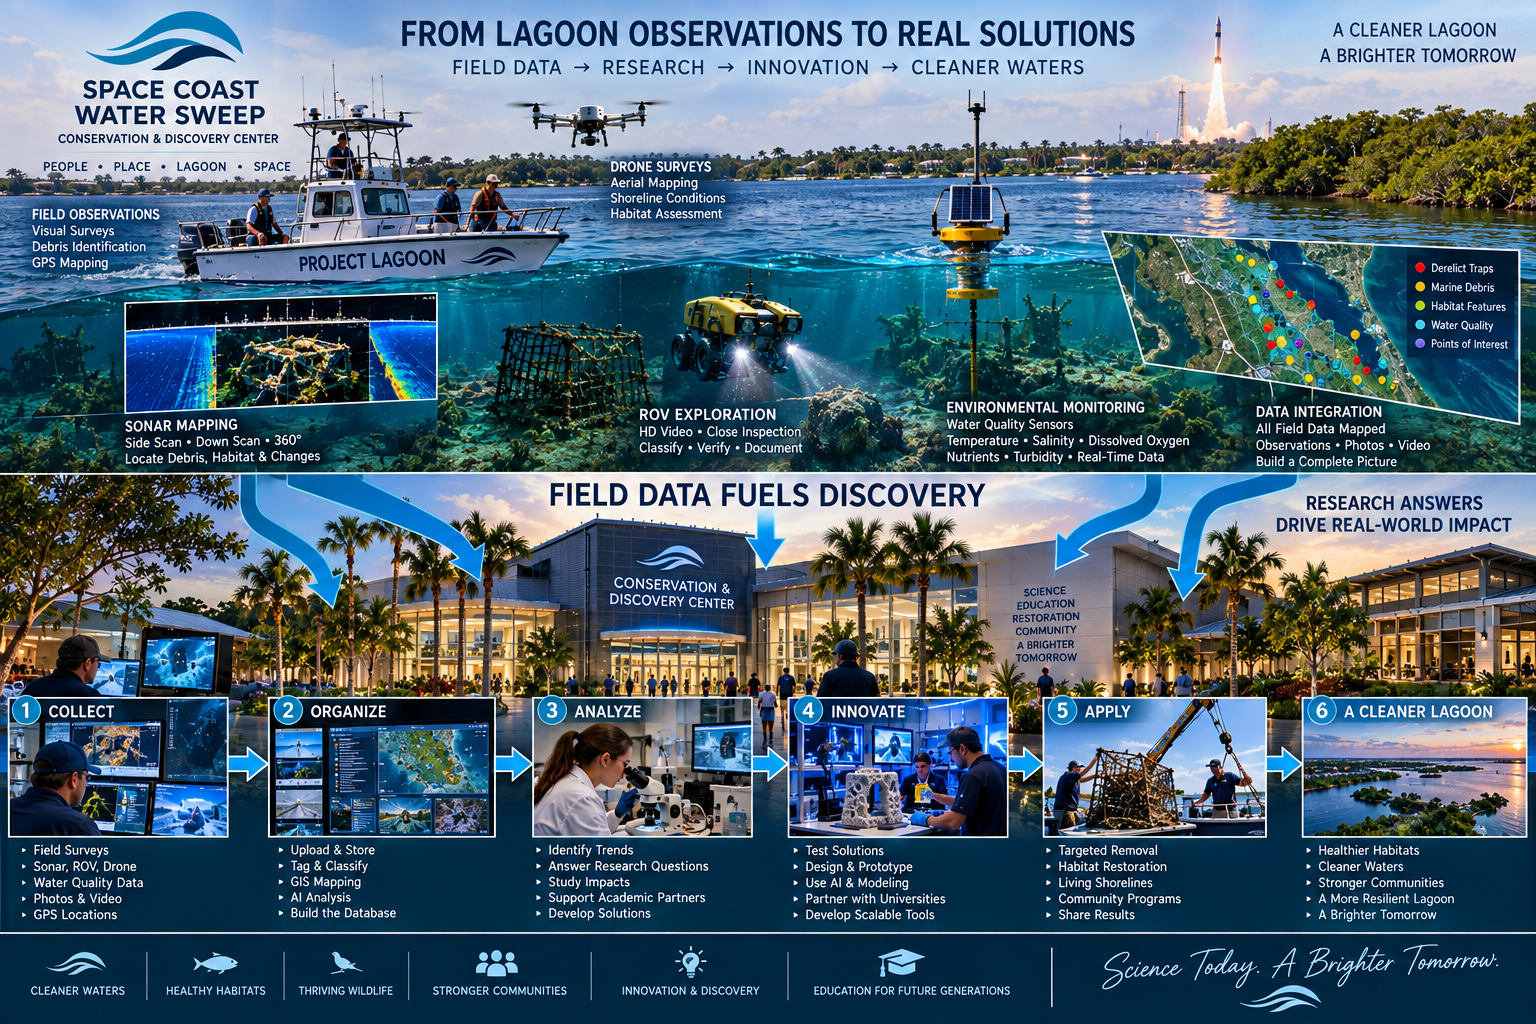
Research-to-impact poster titled 'From Lagoon Observations to Real Solutions' showing field observation methods (visual surveys, sonar side/down/360 scan, ROV HD video, environmental water-quality sensors, data integration mapping), the Conservation & Discovery Center building with 'Field Data Fuels Discovery' banner, and a six-step workflow — Collect, Organize, Analyze, Innovate, Apply, A Cleaner Lagoon — with a footer of mission outcomes (Cleaner Waters, Healthy Habitats, Thriving Wildlife, Stronger Communities, Innovation & Discovery, Education for Future Generations).
02 — RESEARCH

Understand the Environment Before Trying to Change It.

The proposed environmental Research Laboratory may support appropriate analysis of water, sediment, soil, sand, environmental materials, debris-related materials, potential leachate, microplastics, material composition and selected field samples. Future specialized equipment may include technologies such as XRF or other appropriate analytical systems, subject to final research scope, staffing, safety requirements and funding.

The laboratory should support Project Lagoon, restoration research, materials evaluation, environmental monitoring, university collaboration, student research, prototype evaluation and long-term environmental questions.

The proposed laboratory is not an accredited regulatory testing laboratory. It does not currently perform certified compliance testing. Specific analytical capabilities are not promised until equipment, methods and staffing are established.
Water
Sediment / muck
Soil
Sand
Environmental materials
Debris-related materials
Potential leachate
Microplastics
Material composition
Selected field samples
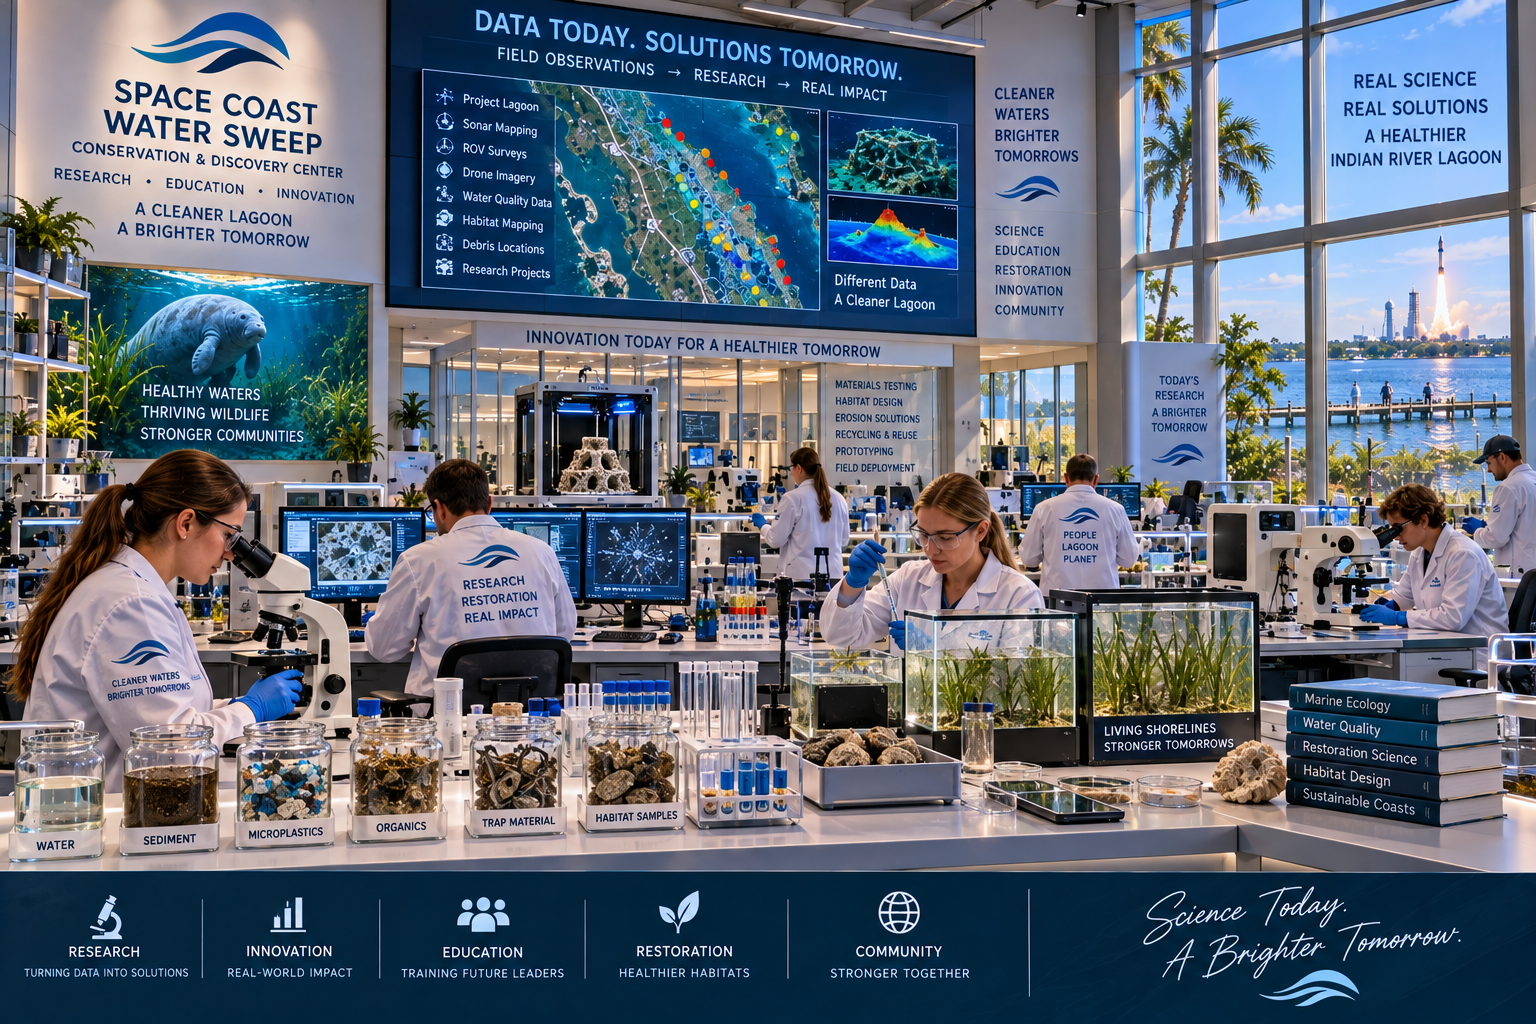
Research lab environment poster titled 'Data Today. Solutions Tomorrow.' showing a digital display with an interactive lagoon map and data sidebar (Project Lagoon, Sonar Mapping, ROV Surveys, Drone Imagery, Water Quality Data, Habitat Mapping, Debris Locations, Research Projects), a 'Innovation Today for a Healthier Tomorrow' banner, lab tables with sample jars (Water, Sediment, Microplastics, Organics, Trap Material, Habitat Samples), a Living Shorelines aquarium, and a footer of mission outcomes (Research, Innovation, Education, Restoration, Community) with 'Science Today. A Brighter Tomorrow.' tagline.
03 — CONNECT THE DATA

The Lagoon Doesn't Produce One Kind of Data.

Environmental understanding may require bringing together many different information sources. The proposed AI/Data Hub can help organize and connect information — organizing observations, comparing datasets, identifying patterns, assisting image/object review, identifying potential hotspots, creating maps, supporting field assignments, generating reports, preserving research provenance and supporting long-term analysis.

AI supports people. AI does not make final scientific, regulatory or recovery decisions autonomously.
Sonar
Drone imagery
ROV imagery
Photographs
GPS tracks
Field observations
Water-quality records
Historical datasets
Research results
Recovery records
Restoration monitoring
Sensor data
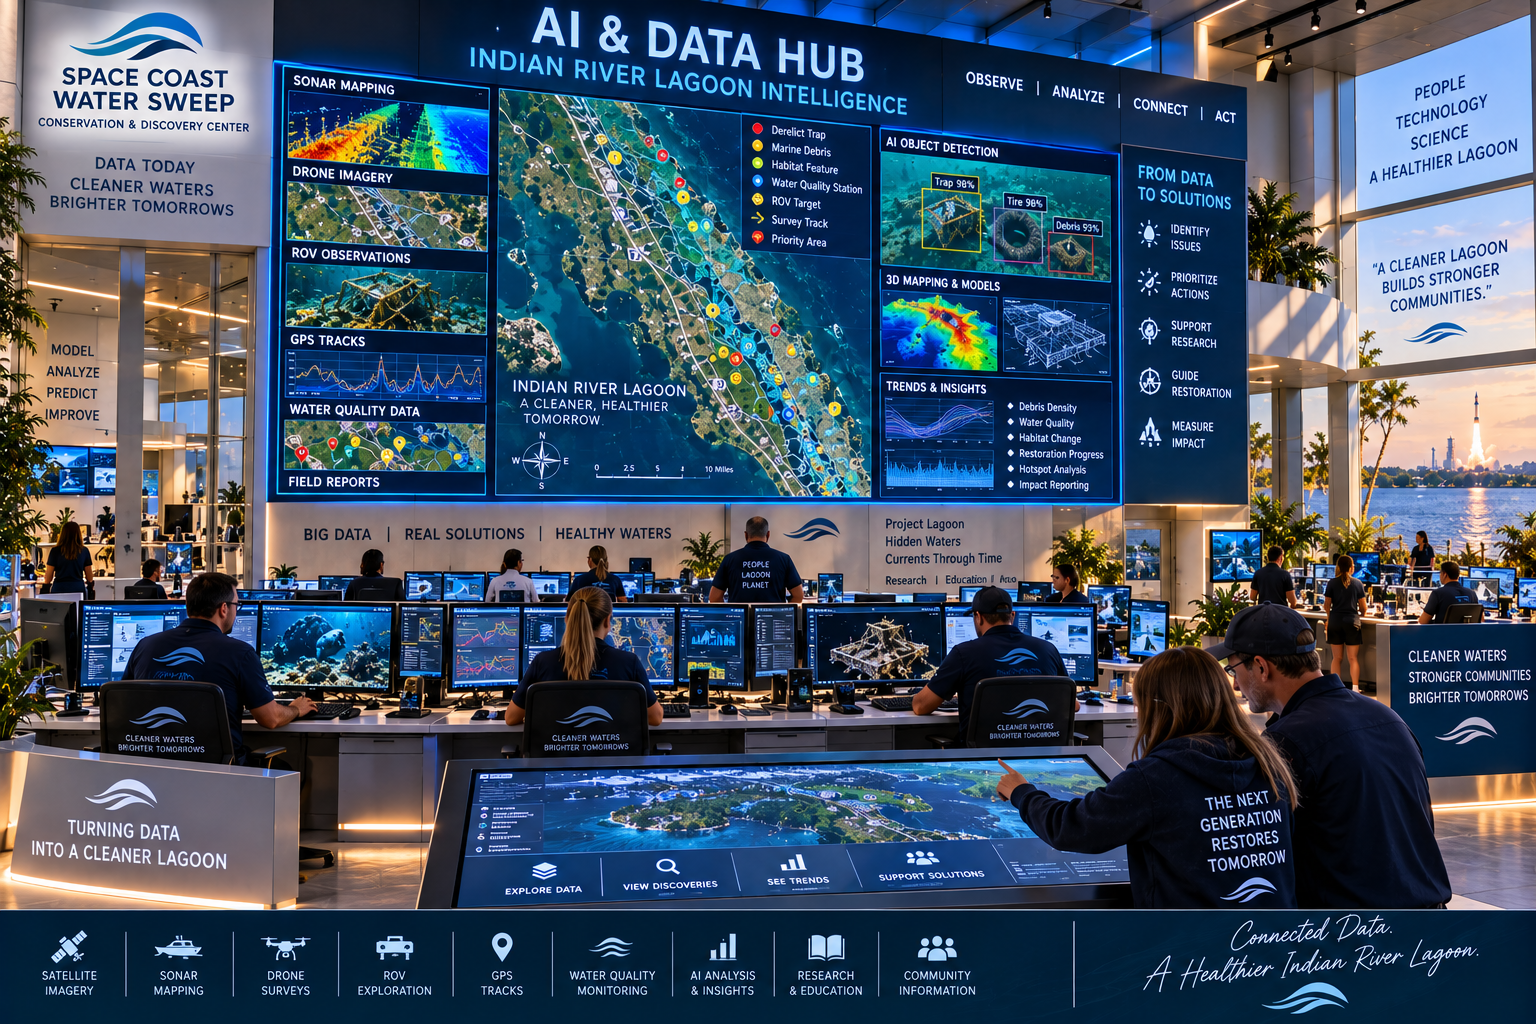
AI & Data Hub control center poster titled 'AI & Data Hub — Indian River Lagoon Intelligence' showing a multi-panel digital wall with geospatial data (Sonar Mapping, Drone Imagery, ROV Observations, GPS Tracks, Water Quality Data, Field Reports), a center satellite map with annotated points (Derelict Trap, Marine Debris, Habitat Feature, Water Quality Station, ROV Target, Survey Track, Priority Area), AI object detection, 3D mapping models, trends and insights panels, a 'From Data to Solutions' workflow list, an interactive touch-table with 'Explore Data / View Discoveries / See Trends / Support Solutions' navigation, and a footer of connected-data categories with 'Connected Data. A Healthier Indian River Lagoon.' tagline.
04 — UNDERSTAND CHANGE

To Understand the Lagoon Today, Sometimes You Have to Look Back.

Currents Through Time is envisioned as an environmental intelligence platform helping people explore evidence and change across the Indian River Lagoon. Project Lagoon and future Center research may eventually contribute appropriate information into this broader environmental intelligence ecosystem.

Not all Project Lagoon data is already integrated into CTT. Environmental datasets should not be overstated.
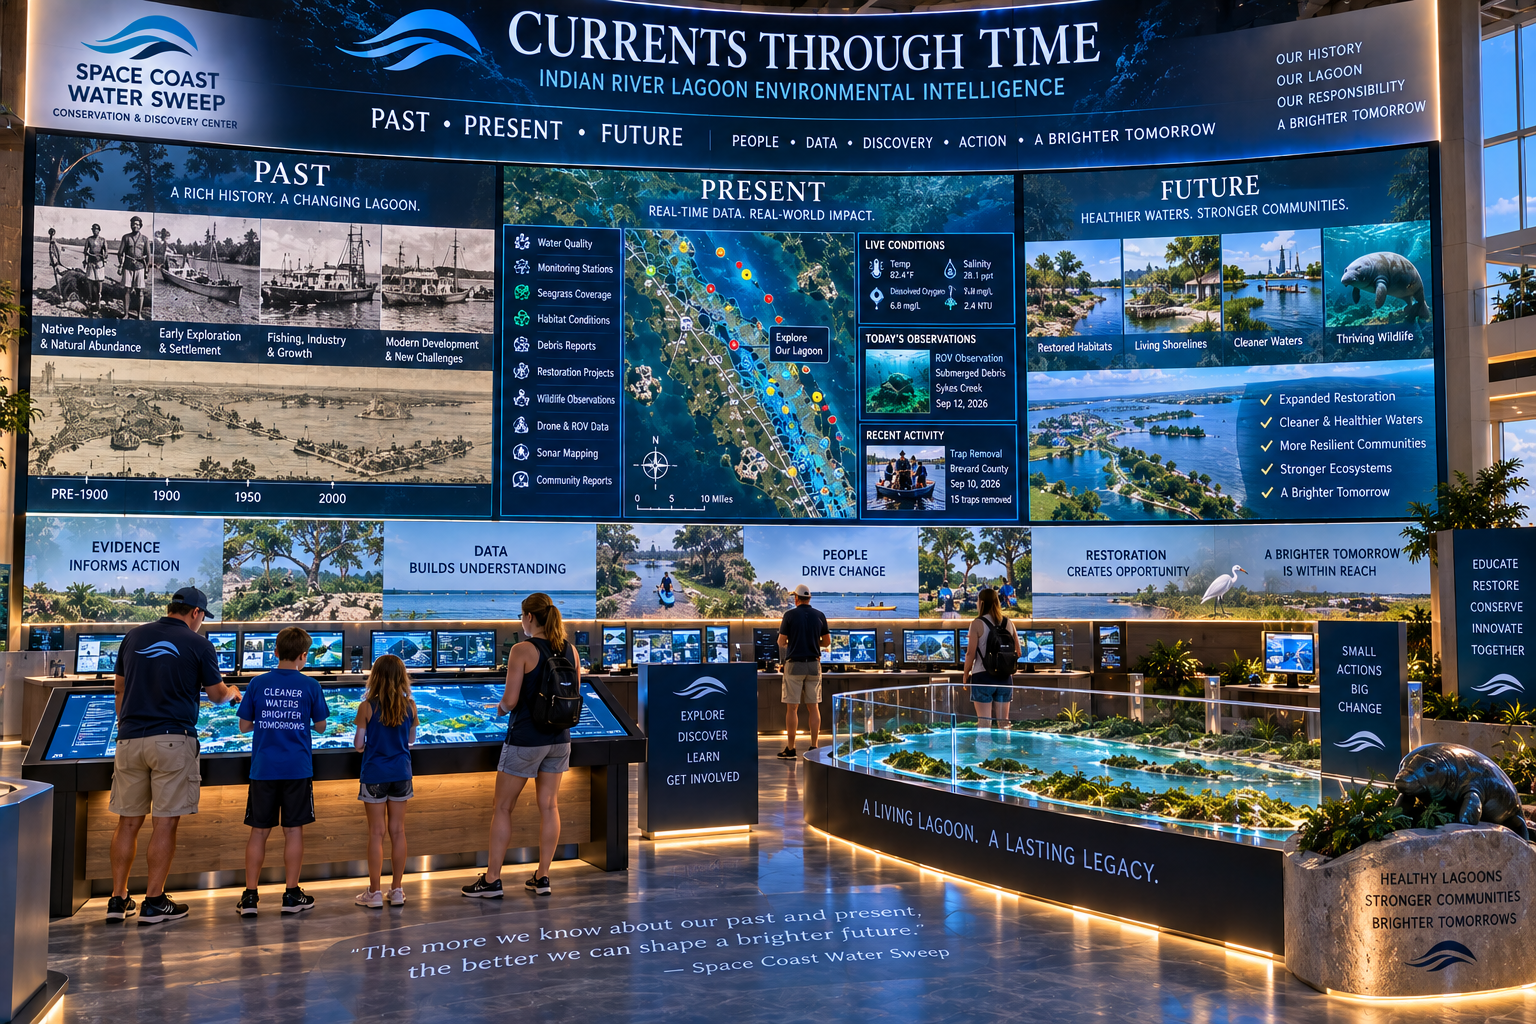
PAST • PRESENT • FUTURE
Historical environmental context
Datasets
Observations
Stations
Restoration projects
Findings
Timeline exploration
Evidence / provenance
Long-term trends
Research interpretation
Public understanding
Currents Through Time exhibition hall poster titled 'Currents Through Time — Indian River Lagoon Environmental Intelligence' with a curved digital wall organized into Past (historical photos and timeline), Present (real-time data map with live conditions, today's observations and recent activity), and Future (restored habitats, living shorelines and positive outcomes) sections, flanked by physical interactive kiosks, a 3D topographic lagoon model, and wayfinding signage with 'Explore / Discover / Learn / Get Involved' and 'Educate / Restore / Conserve / Innovate / Together' pillars, and a floor inscription 'The more we know about our past and present, the better we can shape a brighter future.'
CURRENTS THROUGH TIME — LIVING LAGOON MONITOR

A Century of Lagoon History, Current Conditions and Incoming Data — Visible at a Glance.

Currents Through Time is the environmental intelligence and data platform. The Living Lagoon Monitor is the physical and digital visitor experience powered by that intelligence.

Unlike a traditional museum display, the Living Lagoon Monitor would continue changing as new environmental information enters Currents Through Time. Visitors could literally watch the lagoon's environmental record grow over time.
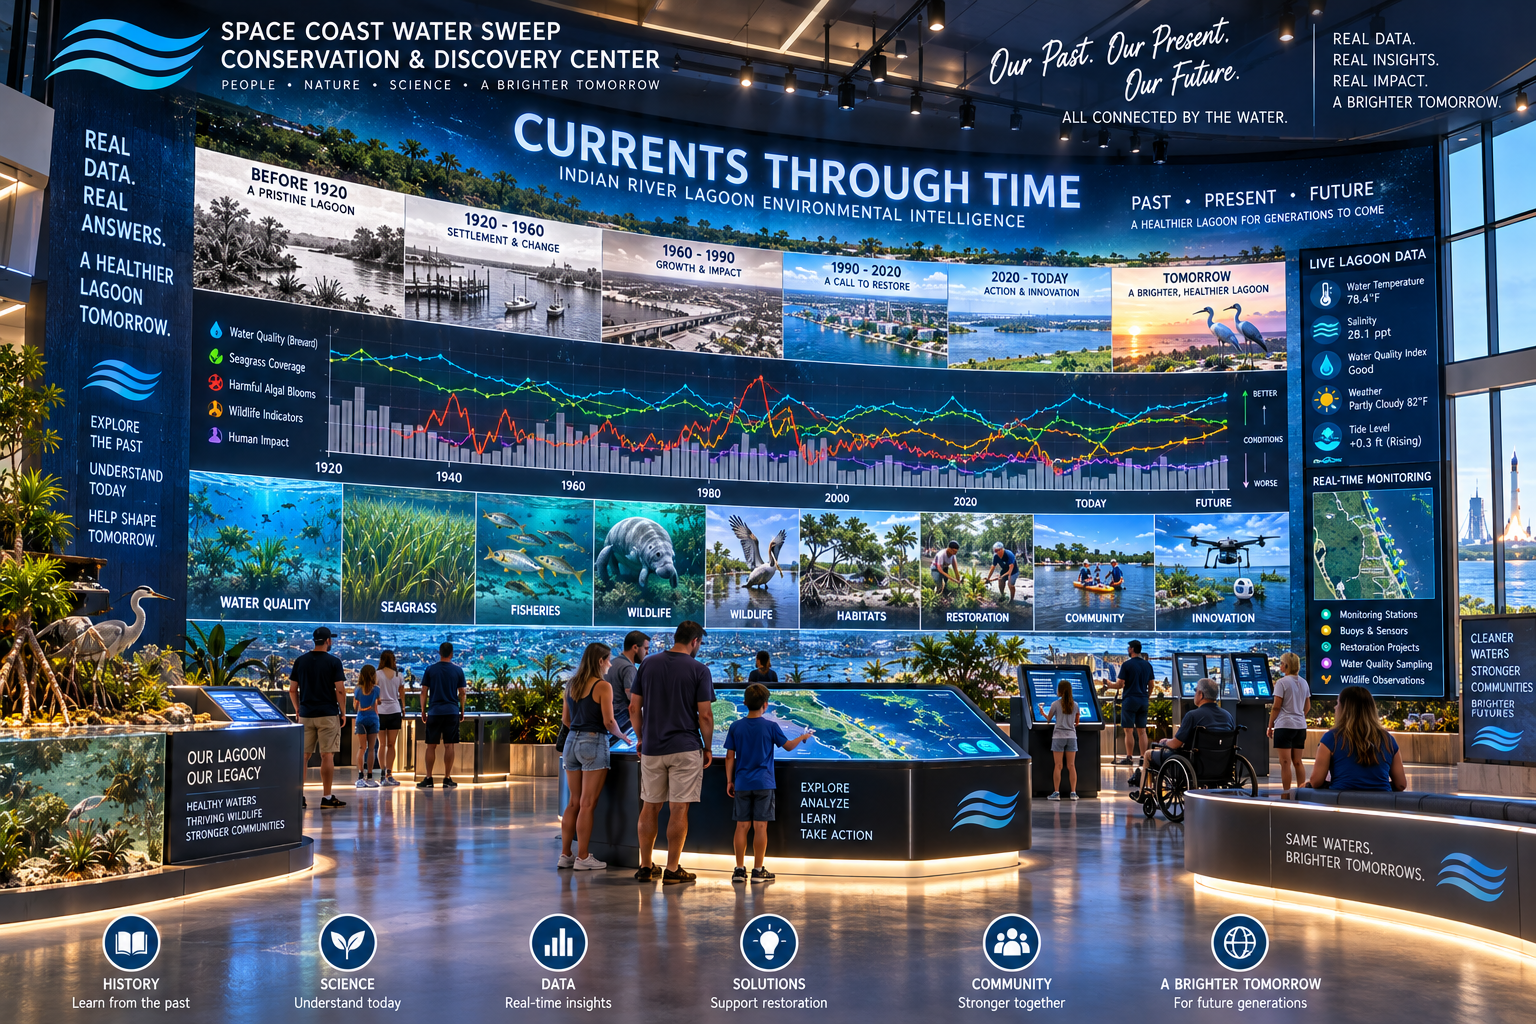
Dramatic interior rendering of the Living Lagoon Monitor gallery with an enormous wall-sized Currents Through Time environmental intelligence display. Visitors stand before a century-plus timeline showing lagoon history, environmental trends, current conditions and incoming data.

Three Layers of the Living Lagoon Monitor

The experience is designed around three interconnected layers.

THE WALL — UNDERSTAND THE LAGOON IN SECONDS

A massive digital environmental timeline showing historical conditions, major environmental events, trends, restoration activity, current conditions and incoming information.

THE EXPLORER — SHOW ME WHY

Interactive displays allowing visitors, students and researchers to explore years, locations, indicators, events, evidence, datasets and environmental changes.

THE LIVE FEED — THE STORY IS STILL BEING WRITTEN

Show new validated observations, monitoring information, Project Lagoon records, research information and other appropriate environmental records becoming part of the growing knowledge base.

THE EXPLORER

Show Me Why.

Students, families and researchers can use adjacent interactive touchscreen stations to explore years, environmental indicators, locations, events and supporting evidence while the large Living Lagoon Monitor remains visible nearby.
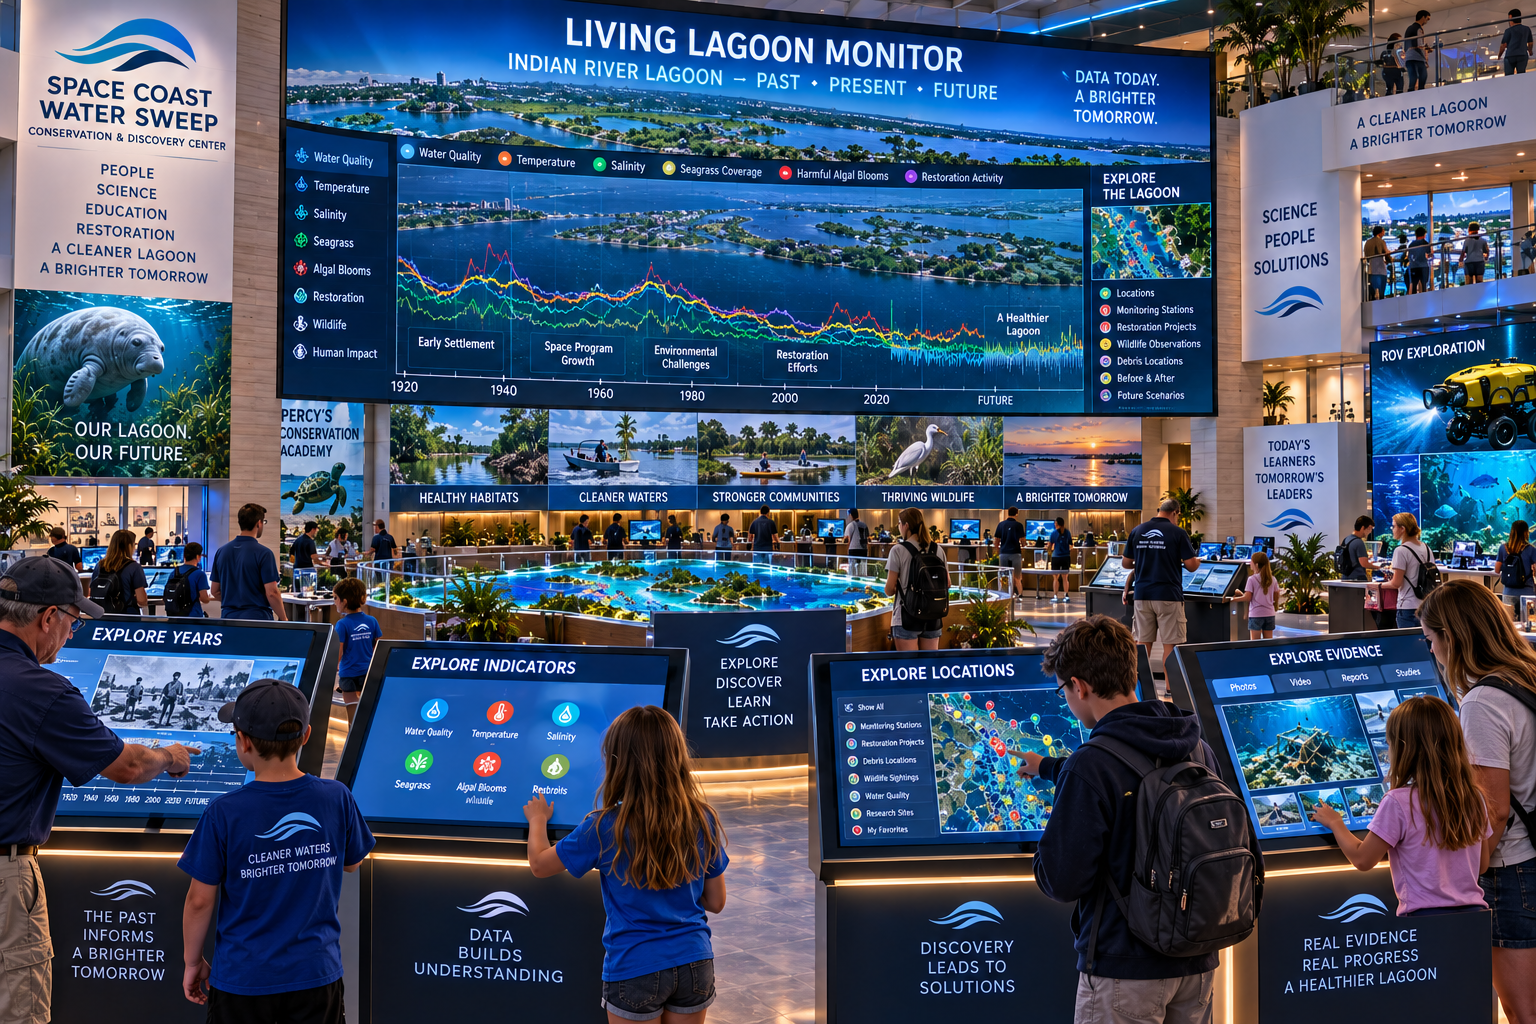
Years
Locations
Indicators
Events
Evidence
Datasets
Environmental changes
Living Lagoon Monitor exhibition hall poster titled 'Living Lagoon Monitor — Indian River Lagoon, Past ♦ Present ♦ Future' showing a curved digital wall with a panoramic lagoon aerial and trend graph (1920–Future), a legend of indicators (Water Quality, Temperature, Salinity, Seagrass, Algal Blooms, Restoration, Wildlife, Human Impact), an 'Explore the Lagoon' sidebar (Locations, Monitoring Stations, Restoration Projects, Wildlife Observations, Debris Locations, Before & After, Future Scenarios), five thematic panels (Healthy Habitats, Cleaner Waters, Stronger Communities, Thriving Wildlife, A Brighter Tomorrow), and four interactive touch-screen kiosks — Explore Years, Explore Indicators, Explore Locations, Explore Evidence — flanked by side signage with a manatee image and an ROV Exploration screen.
THE LIVE FEED

The Story Is Still Being Written.

New validated observations, monitoring information, Project Lagoon records, research information and other appropriate environmental records become part of the growing knowledge base — visible to visitors in real time.
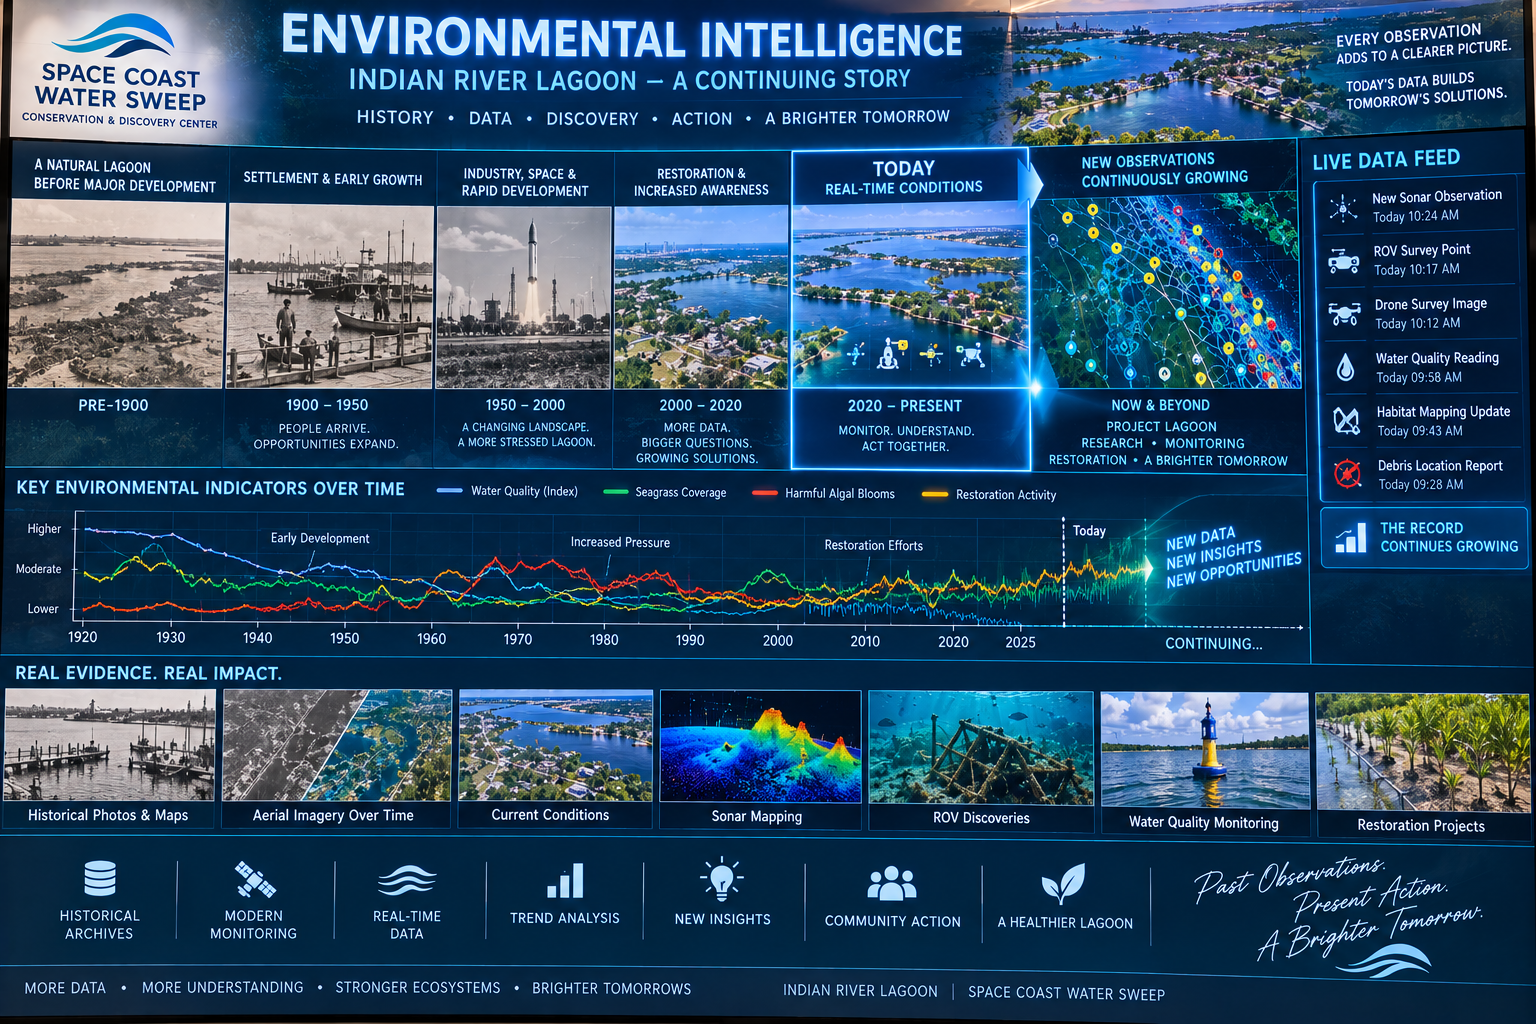
UNDERSTAND MORE THAN A CENTURY OF LAGOON CHANGE IN SECONDS — WHILE SEEING THAT THE STORY IS STILL BEING WRITTEN TODAY.
Water quality
Seagrass
Algae blooms
Dissolved oxygen
Turbidity
Salinity
Temperature
Fish kills
Storms
Restoration activity
Development impacts
Other indicators as Currents Through Time grows
Environmental Intelligence — Indian River Lagoon exhibition hall poster titled 'Environmental Intelligence — Indian River Lagoon, A Continuing Story' showing a six-panel timeline (Pre-1900, 1900-1950, 1950-2000, 2000-2020, Today, Now & Beyond), a Live Data Feed sidebar (Sonar Observation, ROV Survey Point, Drone Survey Image, Water Quality Reading, Habitat Mapping Update, Debris Location Report), a 'Key Environmental Indicators Over Time' chart (Water Quality, Seagrass Coverage, Harmful Algal Blooms, Restoration Activity from 1920 to 2025+), a seven-tile evidence grid (Historical Photos & Maps, Aerial Imagery Over Time, Current Conditions, Sonar Mapping, ROV Discoveries, Water Quality Monitoring, Restoration Projects), and a footer of outcomes (Historical Archives, Modern Monitoring, Real-Time Data, Trend Analysis, New Insights, Community Action, A Healthier Lagoon).
A LIVING EXHIBIT

Unlike a traditional museum display, the Living Lagoon Monitor continues changing as new environmental information enters Currents Through Time. Visitors could literally watch the lagoon's environmental record grow over time.

05 — INVENT

Turn a Research Question Into Something You Can Test.

The proposed Innovation Lab is where ideas can move from research into practical design. It connects the Research Laboratory and AI/Data Hub to the fabrication side of the campus.
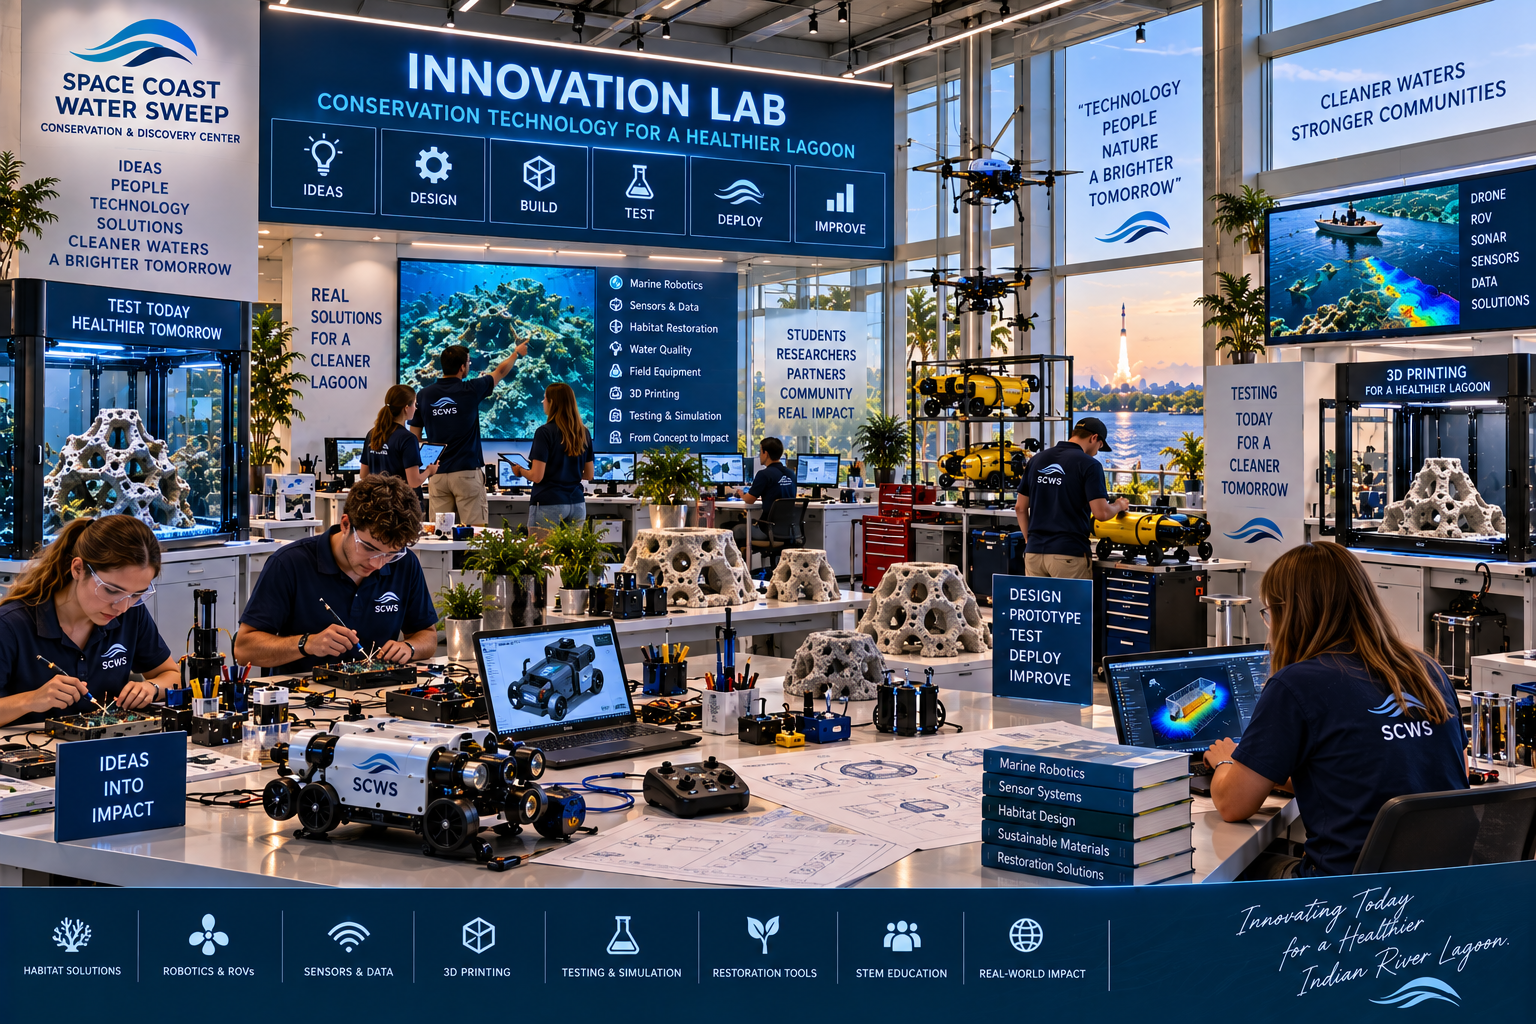
QUESTION → IDEA → DESIGN → PROTOTYPE
Conceptual design
Engineering
CAD
Electronics
Sensors
Robotics
Marine technology
Environmental monitoring devices
ROV / drone components
Prototype development
Software / data tools
Student design projects
Restoration technology
Innovation Lab exhibition hall poster titled 'Innovation Lab — Conservation Technology for a Healthier Lagoon' showing a bright waterfront lab interior with six workflow icons (Ideas, Design, Build, Test, Deploy, Improve), a central digital display listing focus areas (Marine Robotics, Sensors & Data, Habitat Restoration, Water Quality, Field Equipment, 3D Printing, Testing & Simulation, From Concept to Impact), side signage (Ideas, People, Technology, Solutions, Cleaner Waters, A Brighter Tomorrow / Drone, ROV, Sonar, Sensors, Data, Solutions), workstations with 3D CAD laptops, SCWS robotic platforms, 3D-printed coral lattice structures and a book stack (Marine Robotics, Sensor Systems, Habitat Design, Sustainable Materials, Restoration Solutions), and an eight-icon footer (Habitat Solutions, Robotics & ROVs, Sensors & Data, 3D Printing, Testing & Simulation, Restoration Tools, STEM Education, Real-World Impact).
06 — BUILD

Sometimes the Next Conservation Tool Doesn't Exist Yet.

The Conservation Fabrication & Innovation Center is a major component of the long-term campus vision — a high-bay fabrication and prototype-development environment where approved conservation concepts can become physical prototypes.

Not all equipment has already been selected or purchased.
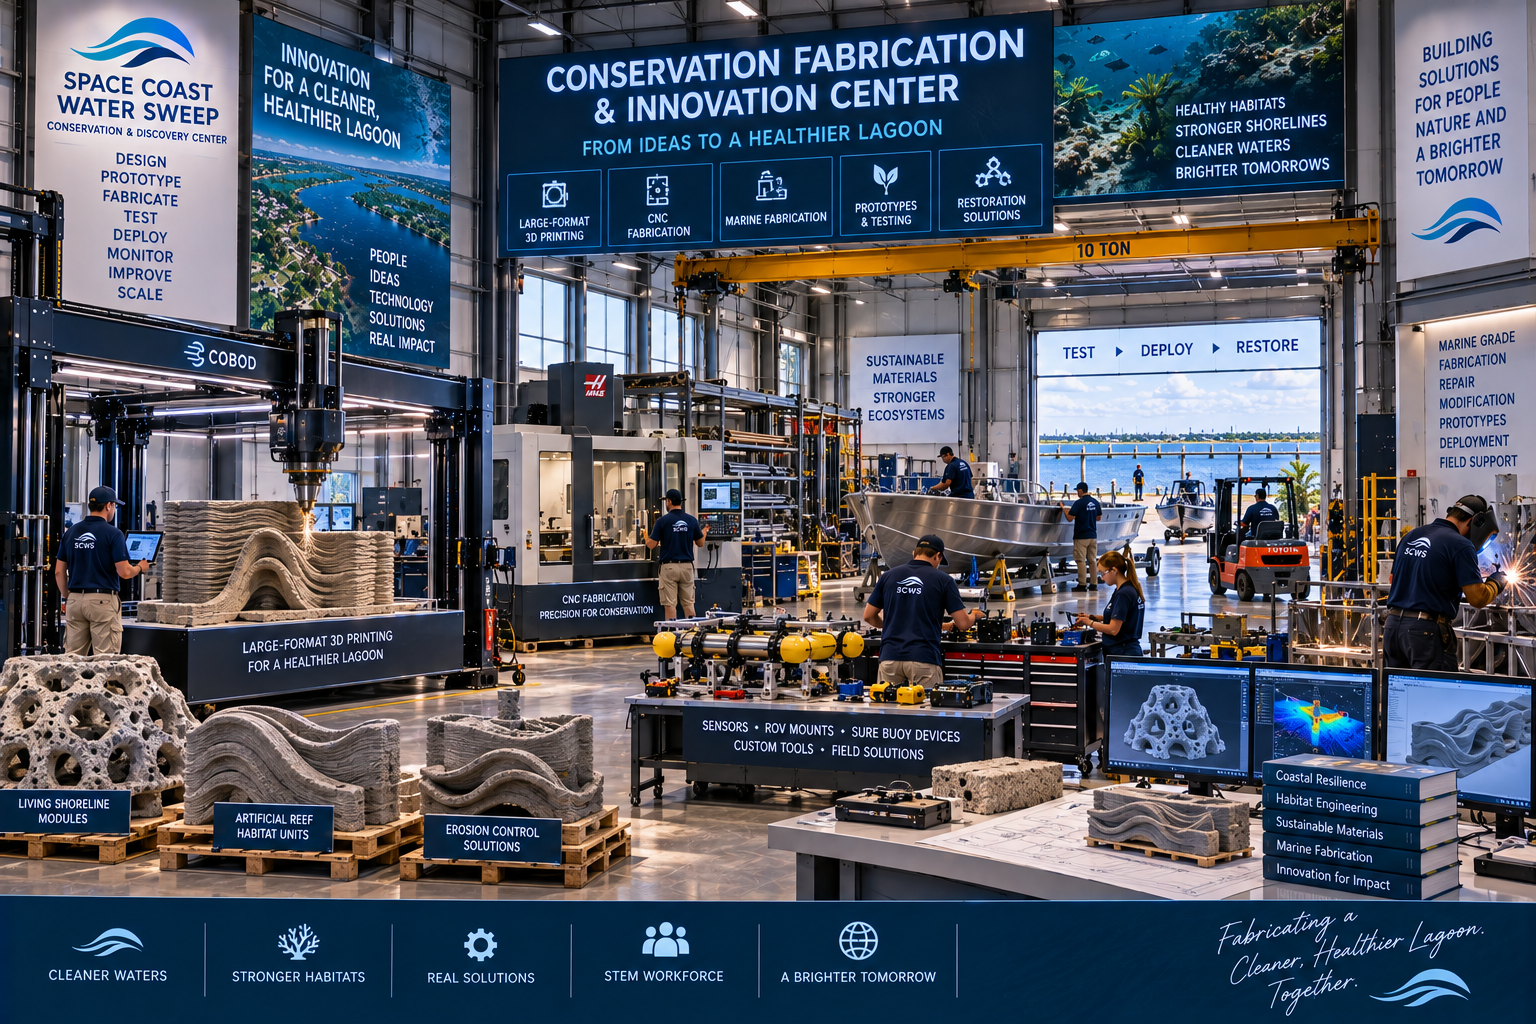
Large-format 3D printing
Appropriate cementitious / concrete additive manufacturing
CNC fabrication
Conventional fabrication
Machining
Marine fabrication
Electronics integration
Sensor integration
Robotics
Prototype assembly
Materials preparation
Testing
Secure tool areas
Raw-material storage
Finished-product staging
Loading / forklift access
Outdoor testing
Direct connection to operations and waterfront deployment
Conservation Fabrication & Innovation Center exhibition hall poster titled 'Conservation Fabrication & Innovation Center — From Ideas to a Healthier Lagoon' showing a high-bay industrial hangar with a 10-ton overhead crane and five capability icons (Large-Format 3D Printing, CNC Fabrication, Marine Fabrication, Prototypes & Testing, Restoration Solutions), left signage (Design, Prototype, Fabricate, Test, Deploy, Monitor, Improve, Scale), right signage (Marine Grade Fabrication, Repair, Modification, Prototypes, Deployment, Field Support), workstation labels (Living Shoreline Modules, Artificial Reef Habitat Units, Erosion Control Solutions / Sensors, ROV Mounts, Sure Buoy Devices, Custom Tools, Field Solutions), a manual stack (Coastal Resilience, Habitat Engineering, Sustainable Materials, Marine Fabrication, Innovation for Impact), and a footer of outcomes (Cleaner Waters, Stronger Habitats, Real Solutions, STEM Workforce, A Brighter Tomorrow).
FROM PROBLEM TO PROTOTYPE

Build for the Problem — Not Just for the Shelf.

These are categories of innovation, not claims of finished commercial products. Development may involve original design, university collaboration, licensed technology, corporate partnerships, existing technology adapted with permission, and freedom-to-operate/IP review where appropriate.

LIVING SHORELINE COMPONENTS

Habitat-supporting shoreline and erosion-control concepts.

HABITAT STRUCTURES

Oyster, fish and other appropriate habitat modules.

WAVE ATTENUATION

Concepts that may help reduce wave energy where environmentally and structurally appropriate.

SEAGRASS PROTECTION

Devices or systems intended to support protection or restoration efforts.

FLOATING MONITORING PLATFORMS

Platforms for sensors, environmental monitoring or research.

SENSOR HOUSINGS & MOUNTS

Field-ready components for environmental instruments.

ROV / DRONE COMPONENTS

Specialized field equipment and research accessories.

MARINE DEBRIS COLLECTION TOOLS

Devices designed around Project Lagoon field experience.

PROJECT LAGOON EQUIPMENT

Custom field tools, baskets, mounts, handling systems and survey equipment.

FUTURE SURE BUOY TECHNOLOGY

Potential future buoy or monitoring-device concepts.
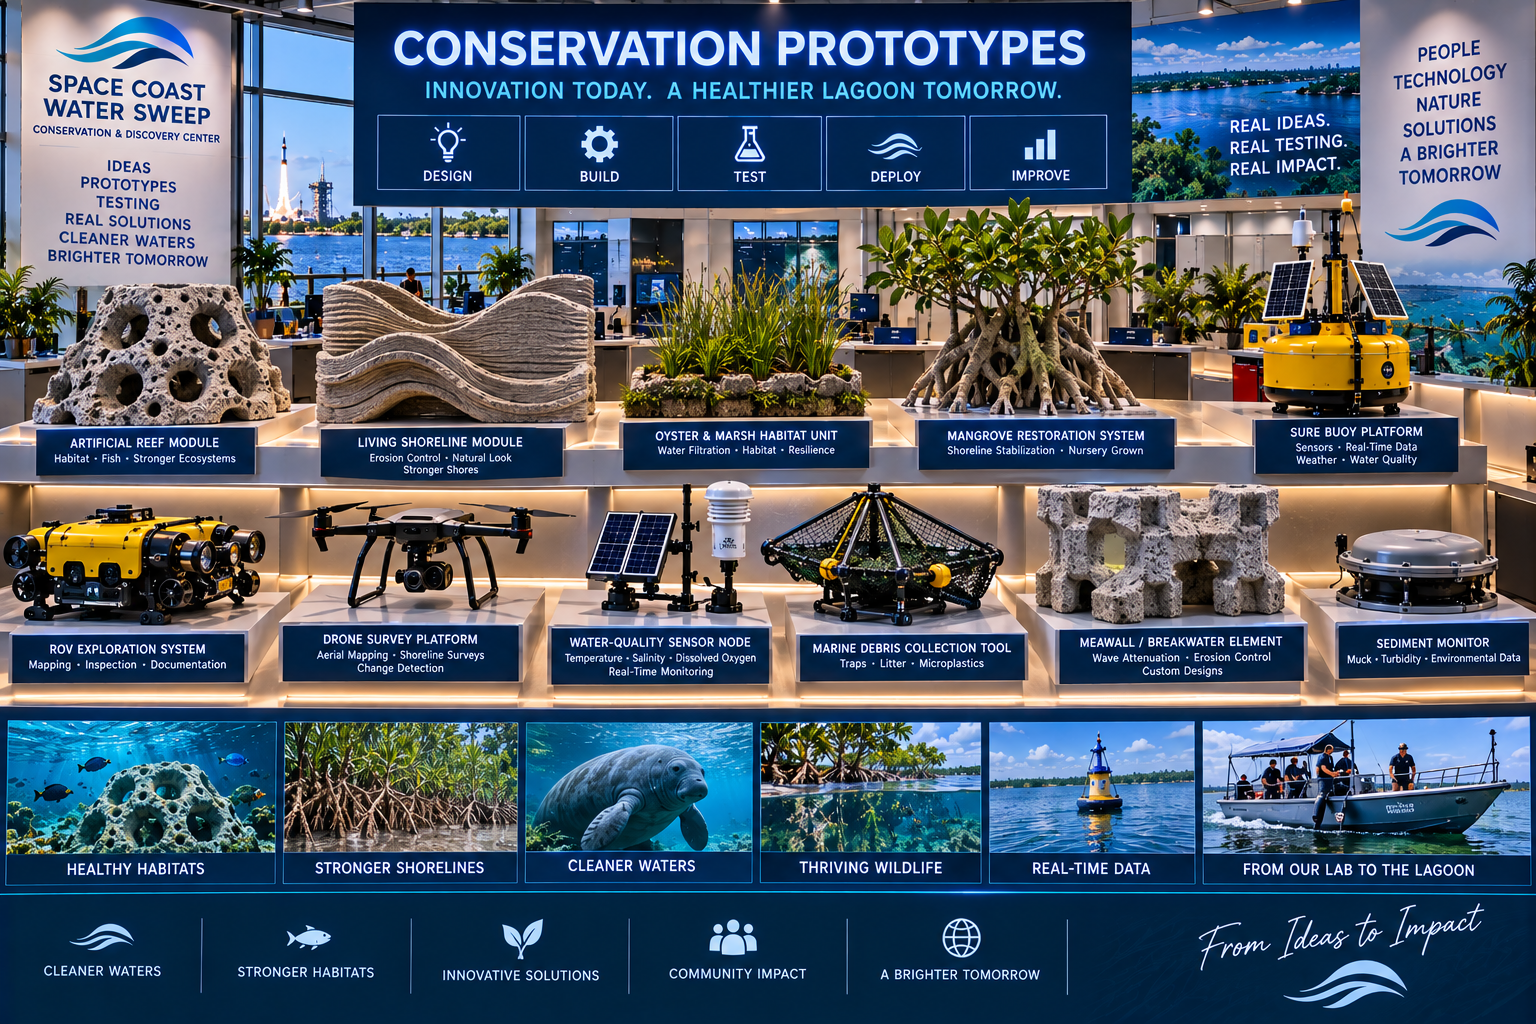
Conservation Prototypes exhibition hall poster titled 'Conservation Prototypes — Innovation Today. A Healthier Lagoon Tomorrow' showing a Design-Build-Test-Deploy-Improve process bar, a top display gallery of five physical prototypes on pedestals (Artificial Reef Module, Living Shoreline Module, Oyster & Marsh Habitat Unit, Mangrove Restoration System, Sure Buoy Platform), a bottom display gallery of six technology pieces (ROV Exploration System, Drone Survey Platform, Water-Quality Sensor Node, Marine Debris Collection Tool, Seawall/Breakwater Element, Sediment Monitor), and a footer photo grid (Healthy Habitats, Stronger Shorelines, Cleaner Waters, Thriving Wildlife, Real-Time Data, From Our Lab to the Lagoon) with outcomes (Cleaner Waters, Stronger Habitats, Innovative Solutions, Community Impact, A Brighter Tomorrow).
07 — BUILD RESPONSIBLY

A Conservation Solution Shouldn't Create a New Environmental Problem.

Materials used for restoration and marine applications must be evaluated carefully. Research and testing should determine suitability — a material is not 'eco-friendly' simply because it is recycled.

Evaluation may include environmental safety, structural performance, durability, marine exposure, leaching, ecological compatibility, manufacturing requirements, deployment method and end-of-life considerations.
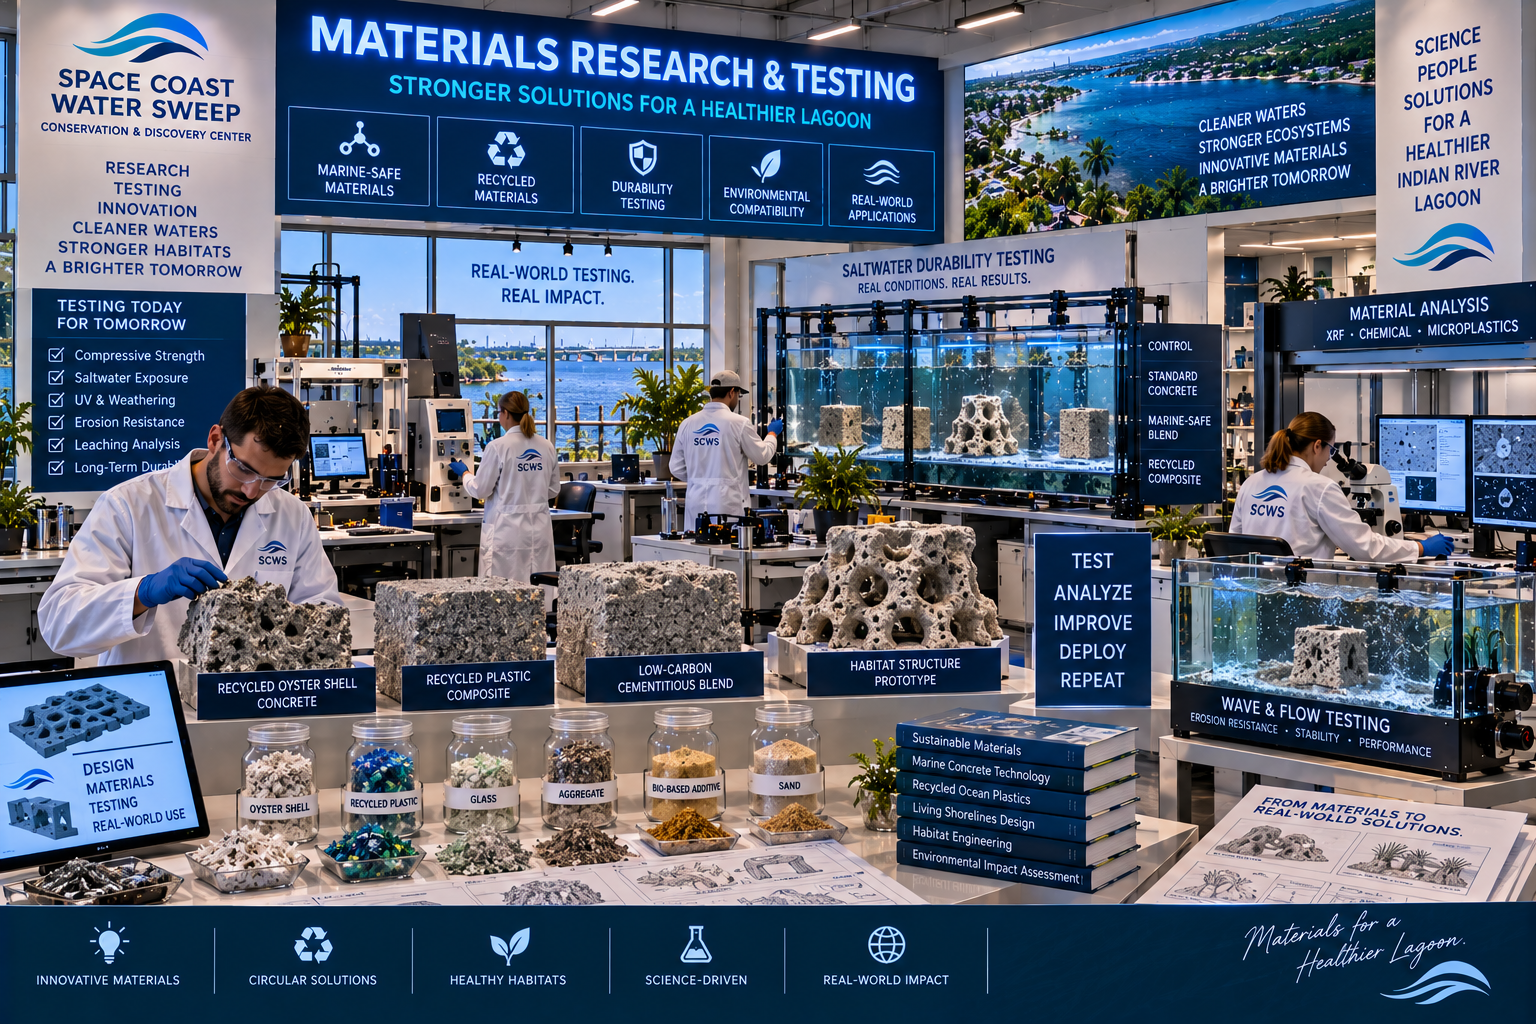
Marine-safe cementitious materials
Recycled / recovered materials
Composites
Biobased materials
Future environmentally appropriate materials
Materials Research & Testing exhibition hall poster titled 'Materials Research & Testing — Stronger Solutions for a Healthier Lagoon' showing a five-icon grid (Marine-Safe Materials, Recycled Materials, Durability Testing, Environmental Compatibility, Real-World Applications), left branding column (Research, Testing, Innovation, Cleaner Waters, Stronger Habitats, A Brighter Tomorrow) with a 'Testing Today for Tomorrow' checklist (Compressive Strength, Saltwater Exposure, UV & Weathering, Erosion Resistance, Leaching Analysis, Long-Term Durability), right column 'Material Analysis — XRF • Chemical • Microplastics', a main lab with river-facing windows, hanging banners ('Real-World Testing. Real Impact.' and 'Saltwater Durability Testing. Real Conditions. Real Results.'), a saltwater durability tank labeled Control/Standard Concrete/Marine-Safe Blend/Recycled Composite, foreground sample tables (Recycled Oyster Shell Concrete, Recycled Plastic Composite, Low-Carbon Cementitious Blend, Habitat Structure Prototype), a Wave & Flow Testing tank, a 'Test Analyze Improve Deploy Repeat' sign, labeled sample jars (Oyster Shell, Recycled Plastic, Glass, Aggregate, Bio-Based Additive, Sand), a book stack (Sustainable Materials, Marine Concrete Technology, Recycled Ocean Plastics, Living Shorelines Design, Habitat Engineering, Environmental Impact Assessment), and a footer of outcomes (Innovative Materials, Circular Solutions, Healthy Habitats, Science-Driven, Real-World Impact).
08 — DEPLOY

The Lagoon Becomes Part of the Testing Process.

Appropriate prototypes can move from controlled testing into carefully planned field pilots. All deployment remains subject to ownership/site permission, engineering, environmental review, permitting, navigation considerations, agency requirements, research protocols and monitoring requirements.
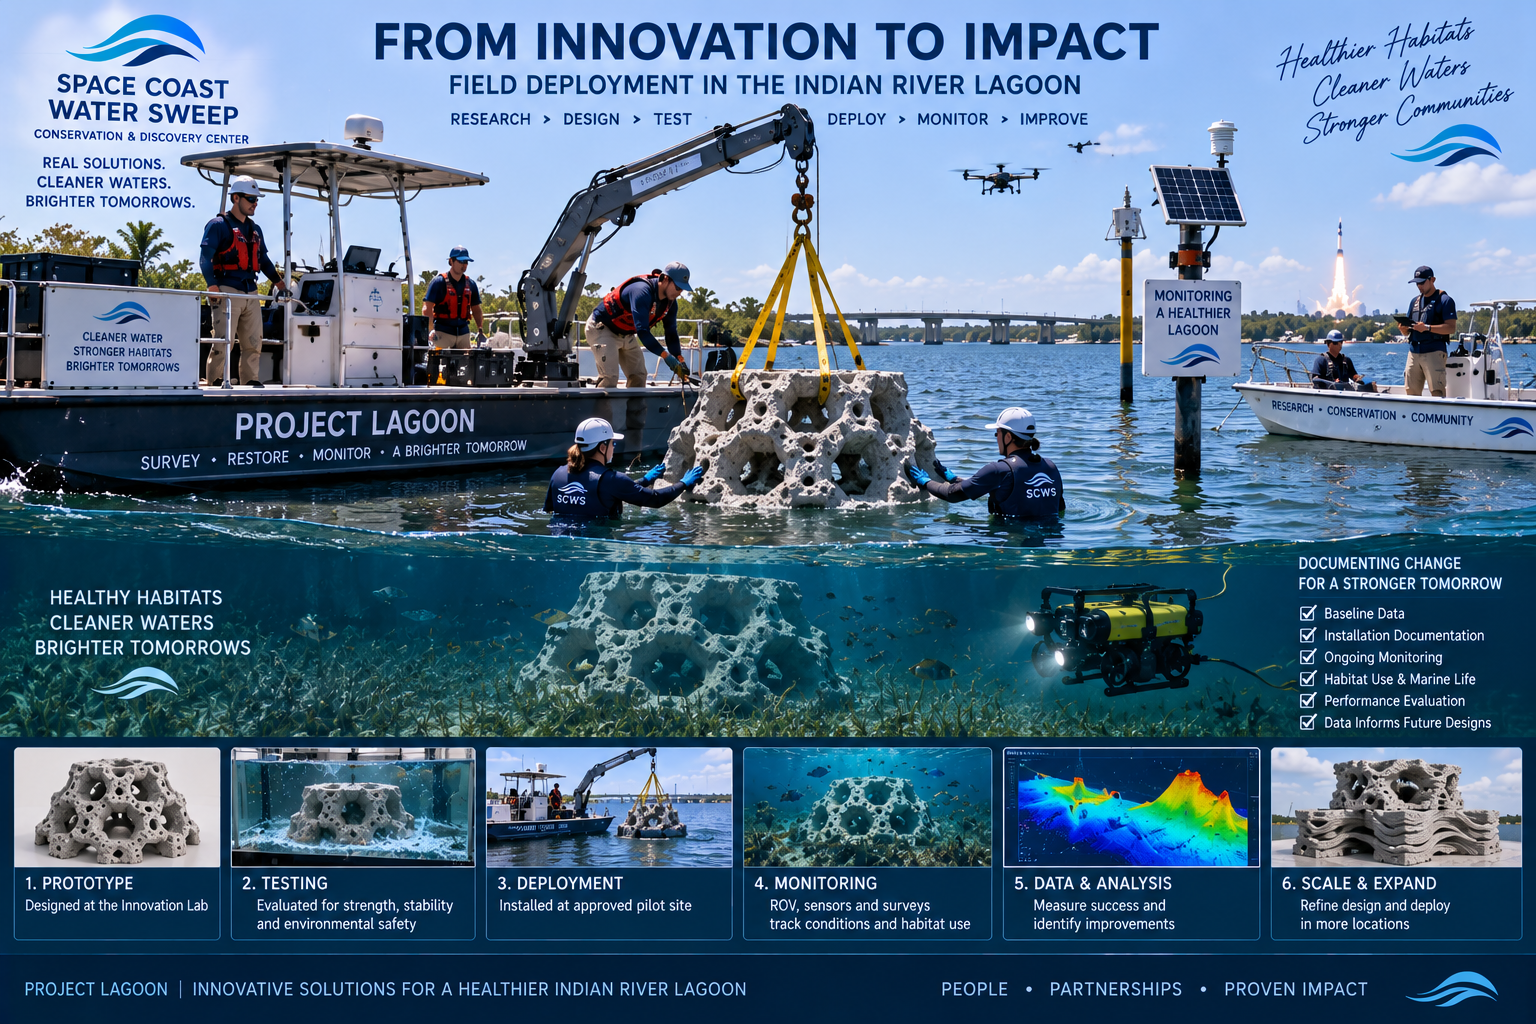
LAB TEST→CONTROLLED PROTOTYPE→PERMITTED FIELD PILOT→MONITOR→RECOVER OR MAINTAIN→ANALYZE
From Innovation to Impact exhibition hall poster titled 'From Innovation to Impact — Field Deployment in the Indian River Lagoon' showing the Project Lagoon boat with a crane lowering a 3D-printed-style habitat structure into the lagoon while divers position it, a drone and secondary research boat overhead, a 'Monitoring a Healthier Lagoon' sign, a rocket launch in the background, an underwater view of the structure resting on the seabed with fish and a yellow ROV conducting inspection, a right-side panel 'Documenting Change for a Stronger Tomorrow' with a checklist (Baseline Data, Installation Documentation, Ongoing Monitoring, Habitat Use & Marine Life, Performance Evaluation, Data Informs Future Designs), and a six-step process gallery footer (Prototype, Testing, Deployment, Monitoring, Data & Analysis, Scale & Expand).
09 — MEASURE

If We Don't Measure What Happens Next, We Haven't Finished the Experiment.

Deployment should be followed by monitoring. Possible measures depend on the project but could include physical durability, structural condition, habitat use, sediment response, shoreline response, water conditions, biological observations, maintenance requirements, sensor performance, failure modes, unintended impacts and comparison with baseline conditions. Monitoring connects to Hidden Waters, Project Lagoon, the AI/Data Hub, the Research Laboratory and Currents Through Time where appropriate.
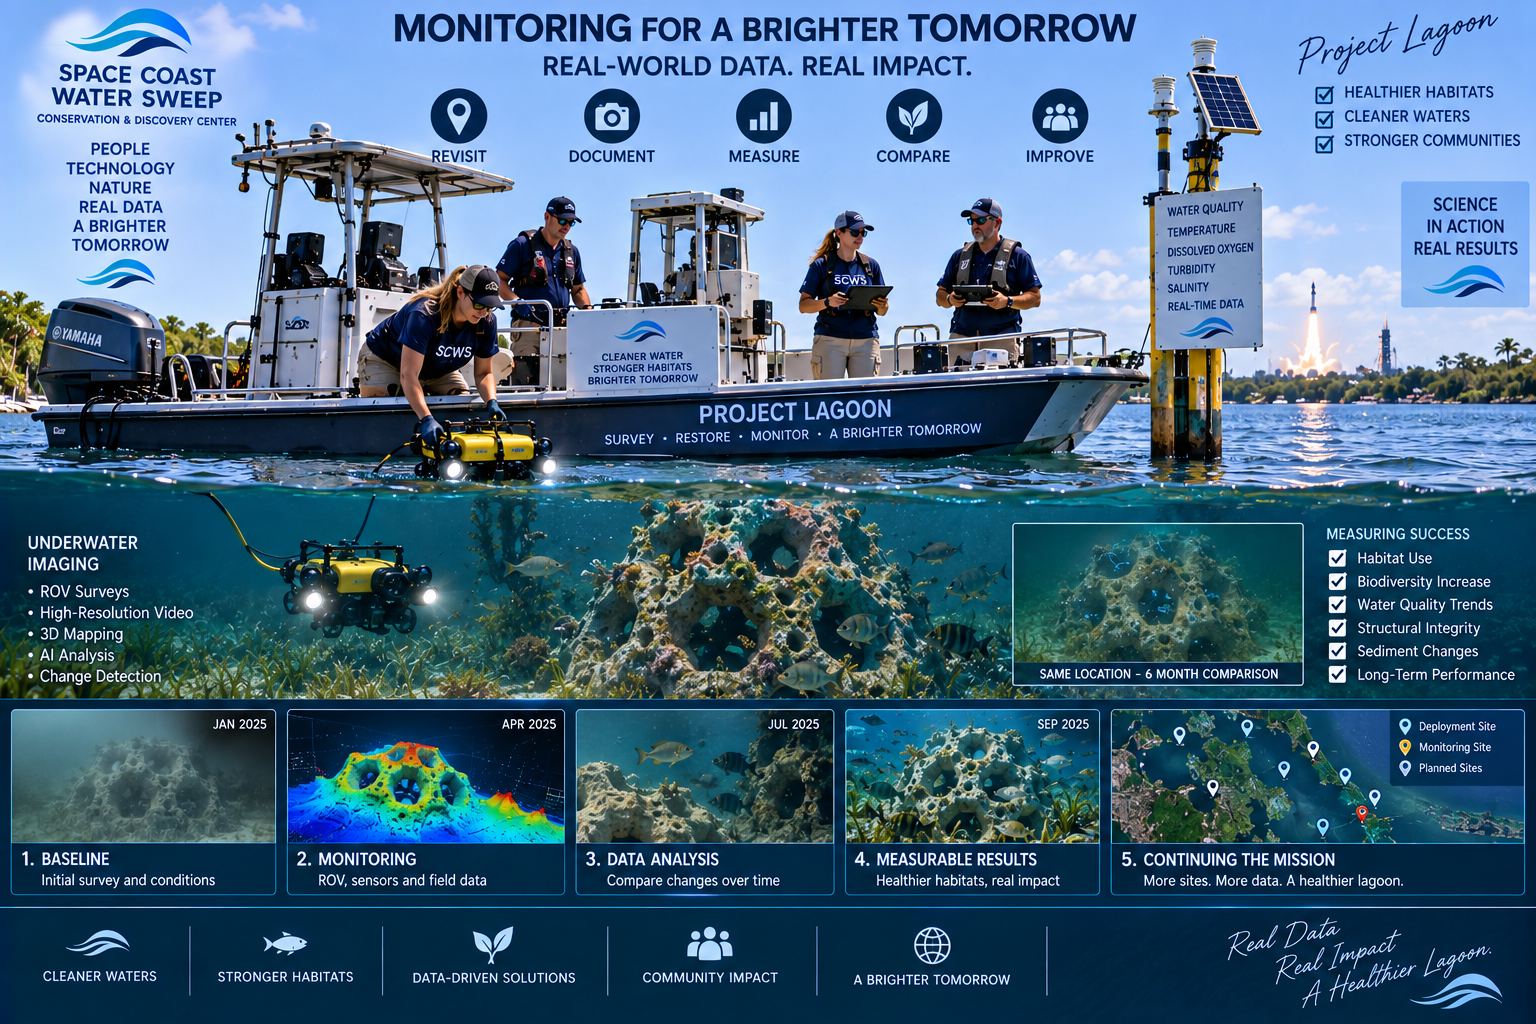
DEPLOY→MONITOR→ANALYZE→IMPROVE
Monitoring for a Brighter Tomorrow exhibition hall poster titled 'Monitoring for a Brighter Tomorrow — Real-World Data. Real Impact.' showing a five-icon header (Revisit, Document, Measure, Compare, Improve), a Project Lagoon boat with SCWS crew operating a yellow ROV and a yellow water-quality sensor pole (Temperature, Dissolved Oxygen, Turbidity, Salinity, Real-Time Data), an underwater section with an 'Underwater Imaging' list (ROV Surveys, High-Resolution Video, 3D Mapping, AI Analysis, Change Detection), a submerged artificial reef, a 'Same Location — 6 Month Comparison' photo with a 'Measuring Success' checklist (Habitat Use, Biodiversity Increase, Water Quality Trends, Structural Integrity, Sediment Changes, Long-Term Performance), a five-panel process timeline (Baseline, Monitoring, Data Analysis, Measurable Results, Continuing the Mission with deployment/monitoring/planned-site pins), and a footer of outcomes (Cleaner Waters, Stronger Habitats, Data-Driven Solutions, Community Impact, A Brighter Tomorrow).
10 — ITERATE

The First Version Doesn't Have to Be the Final Version.

Unsuccessful results can still provide valuable information. The Center should encourage evidence-based improvement rather than treating every prototype as a success.

TEST→FIND WEAKNESSES→REDESIGN→REBUILD→RETEST

A FAILED TEST CAN STILL BE A SUCCESSFUL EXPERIMENT IF WE LEARN FROM IT.
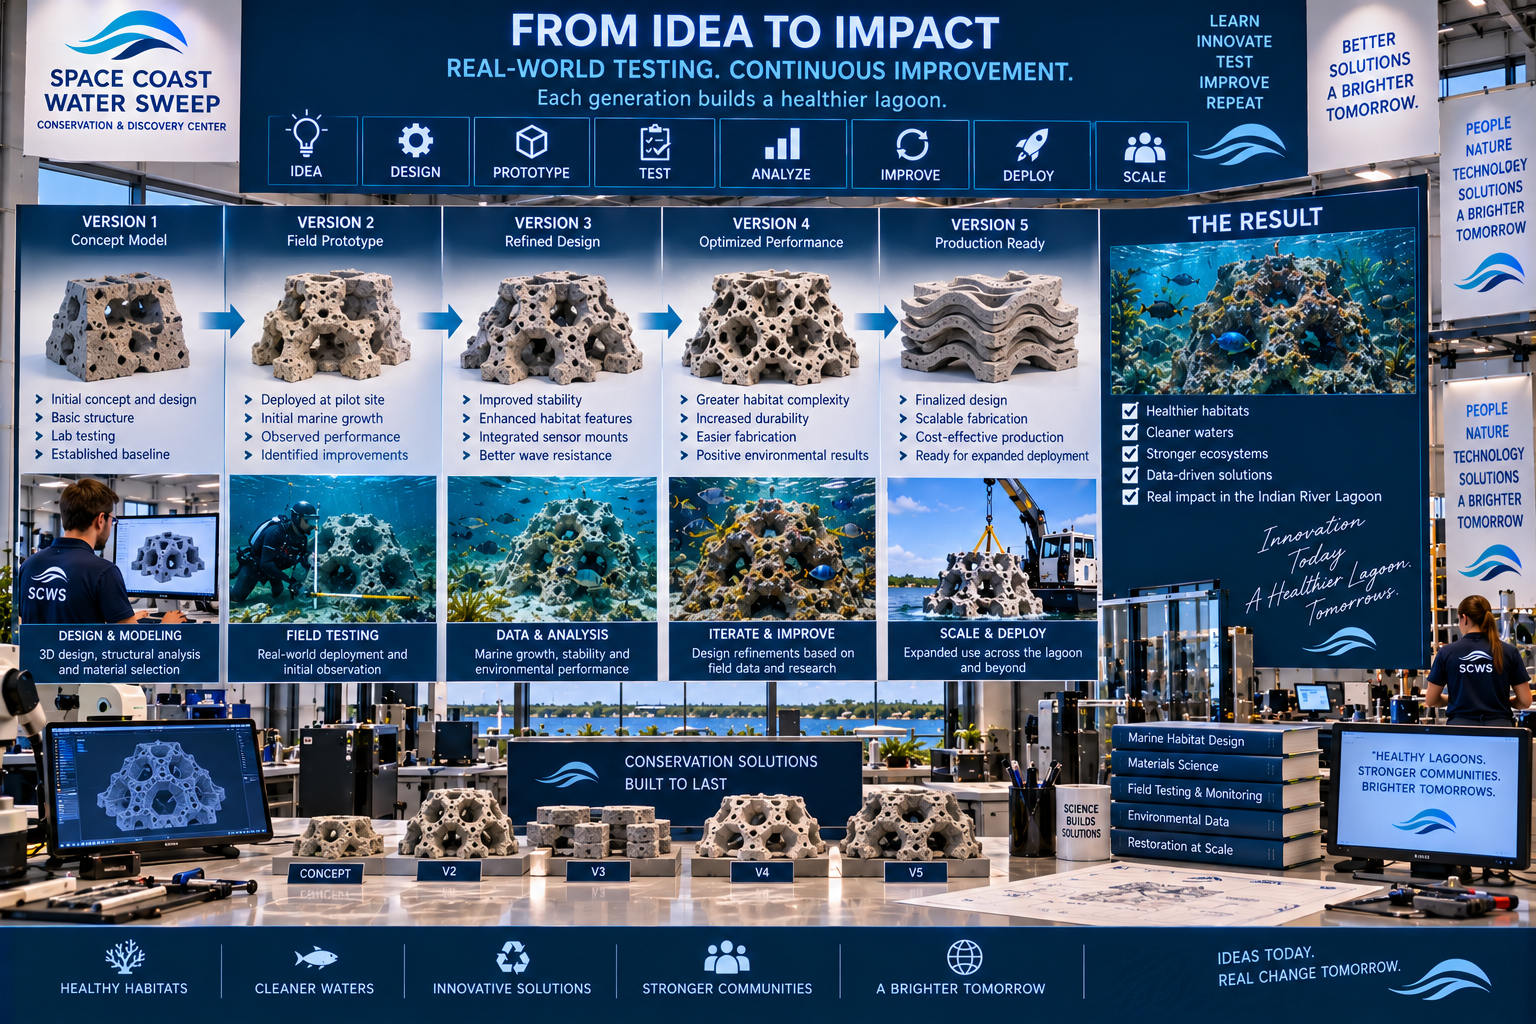
From Idea to Impact exhibition hall poster titled 'From Idea to Impact — Real-World Testing. Continuous Improvement.' showing an eight-icon process bar (Idea, Design, Prototype, Test, Analyze, Improve, Deploy, Scale), five evolving prototype versions on pedestals (Version 1 Concept Model, Version 2 Field Prototype, Version 3 Refined Design, Version 4 Optimized Performance, Version 5 Production Ready) each with a progression of lattice-structure photos and improvement bullets, a right-side 'The Result' panel with an underwater habitat photo and a checklist (Healthier Habitats, Cleaner Waters, Stronger Ecosystems, Data-Driven Solutions, Real Impact in the Indian River Lagoon), and a footer of outcomes (Healthy Habitats, Cleaner Waters, Innovative Solutions, Stronger Communities, A Brighter Tomorrow).
11 — LEARN BY DOING

What If a Student Project Could End Up in the Lagoon?

The potential university and college collaboration model connects classroom learning to real-world conservation impact. Potential opportunities include capstone projects, senior design, undergraduate research, graduate research, internships, field research, prototype development, environmental monitoring and data analysis.

No university has formally partnered unless authorized.
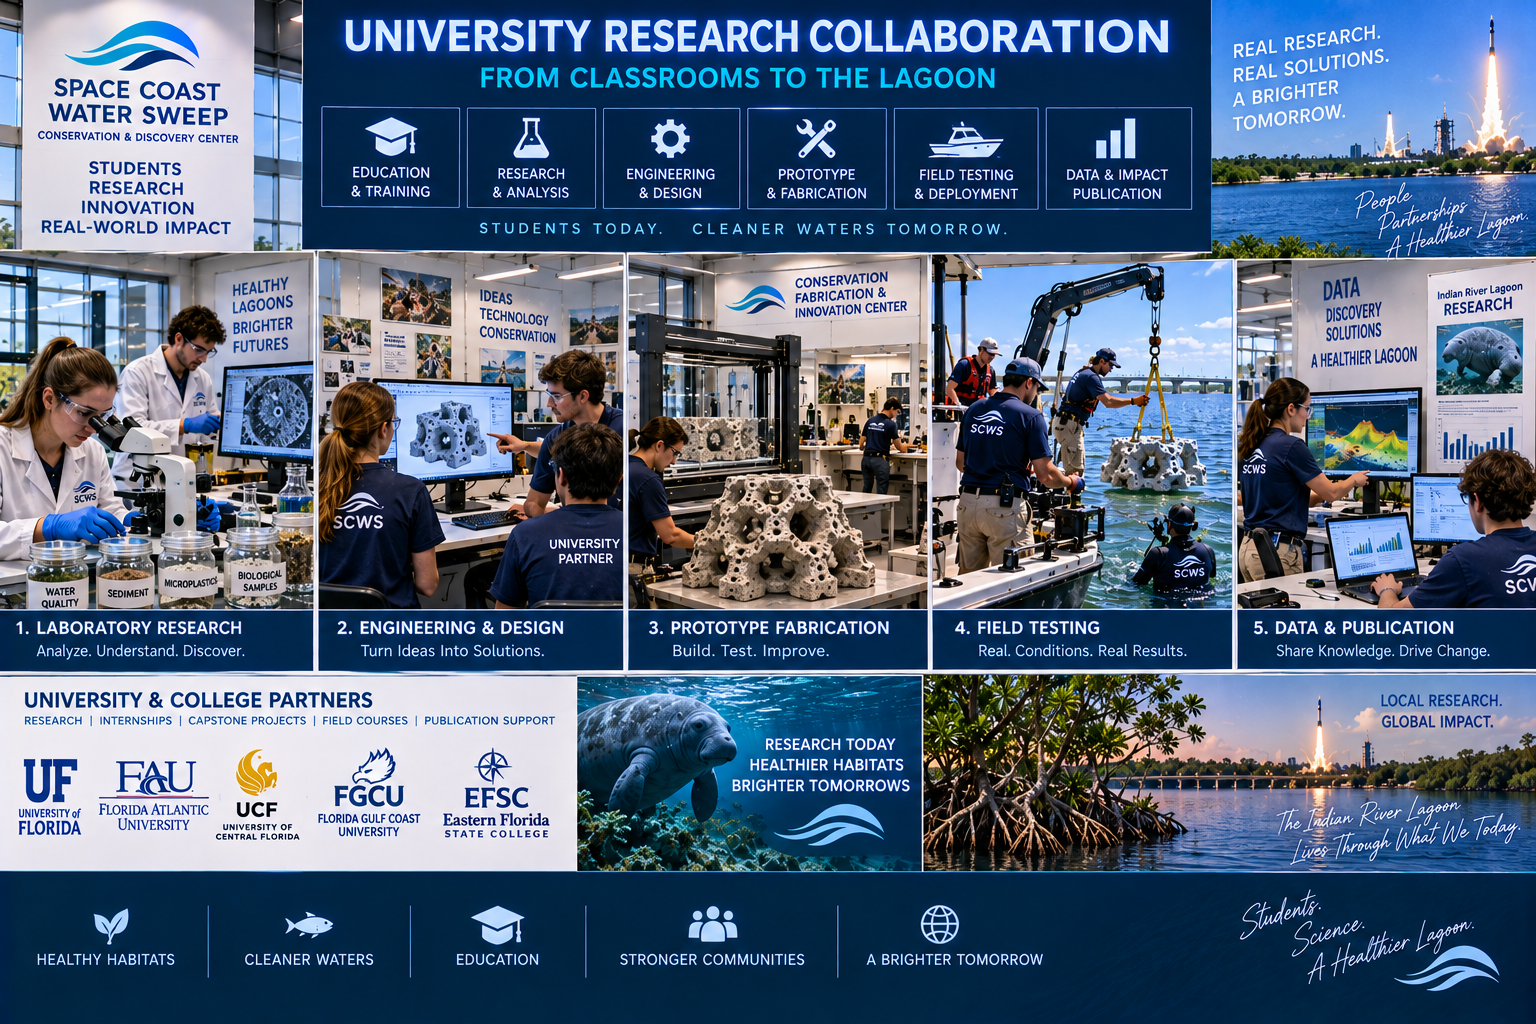
CLASSROOM → LAB → FABRICATION → FIELD → DATA → REAL-WORLD IMPACT
Marine science
Environmental science
Engineering
Materials science
Robotics
Computer science
AI / data science
GIS
Biology
Ecology
Coastal engineering
Environmental technology
University Research Collaboration exhibition wall titled 'University Research Collaboration — From Classrooms to the Lagoon' showing a six-icon process bar (Education & Training, Research & Analysis, Engineering & Design, Prototype & Fabrication, Field Testing & Deployment, Data & Impact Publication), a five-panel process grid (Laboratory Research, Engineering & Design, Prototype Fabrication, Field Testing, Data & Publication) each with student photos and captions, a University & College Partners block (UF, FAU, UCF, FGCU, EFSC) with sub-labels (Research, Internships, Capstone Projects, Field Courses, Publication Support), and a footer of outcomes (Healthy Habitats, Cleaner Waters, Education, Stronger Communities, A Brighter Tomorrow).
12 — WATCH IT HAPPEN

Don't Hide the Work Behind a Wall.

Appropriate portions of the Science & Innovation campus can become part of the visitor experience. Visitors and school groups could safely observe real work without entering controlled laboratory or industrial areas. This connects to Percy's Conservation Academy and STEM education.
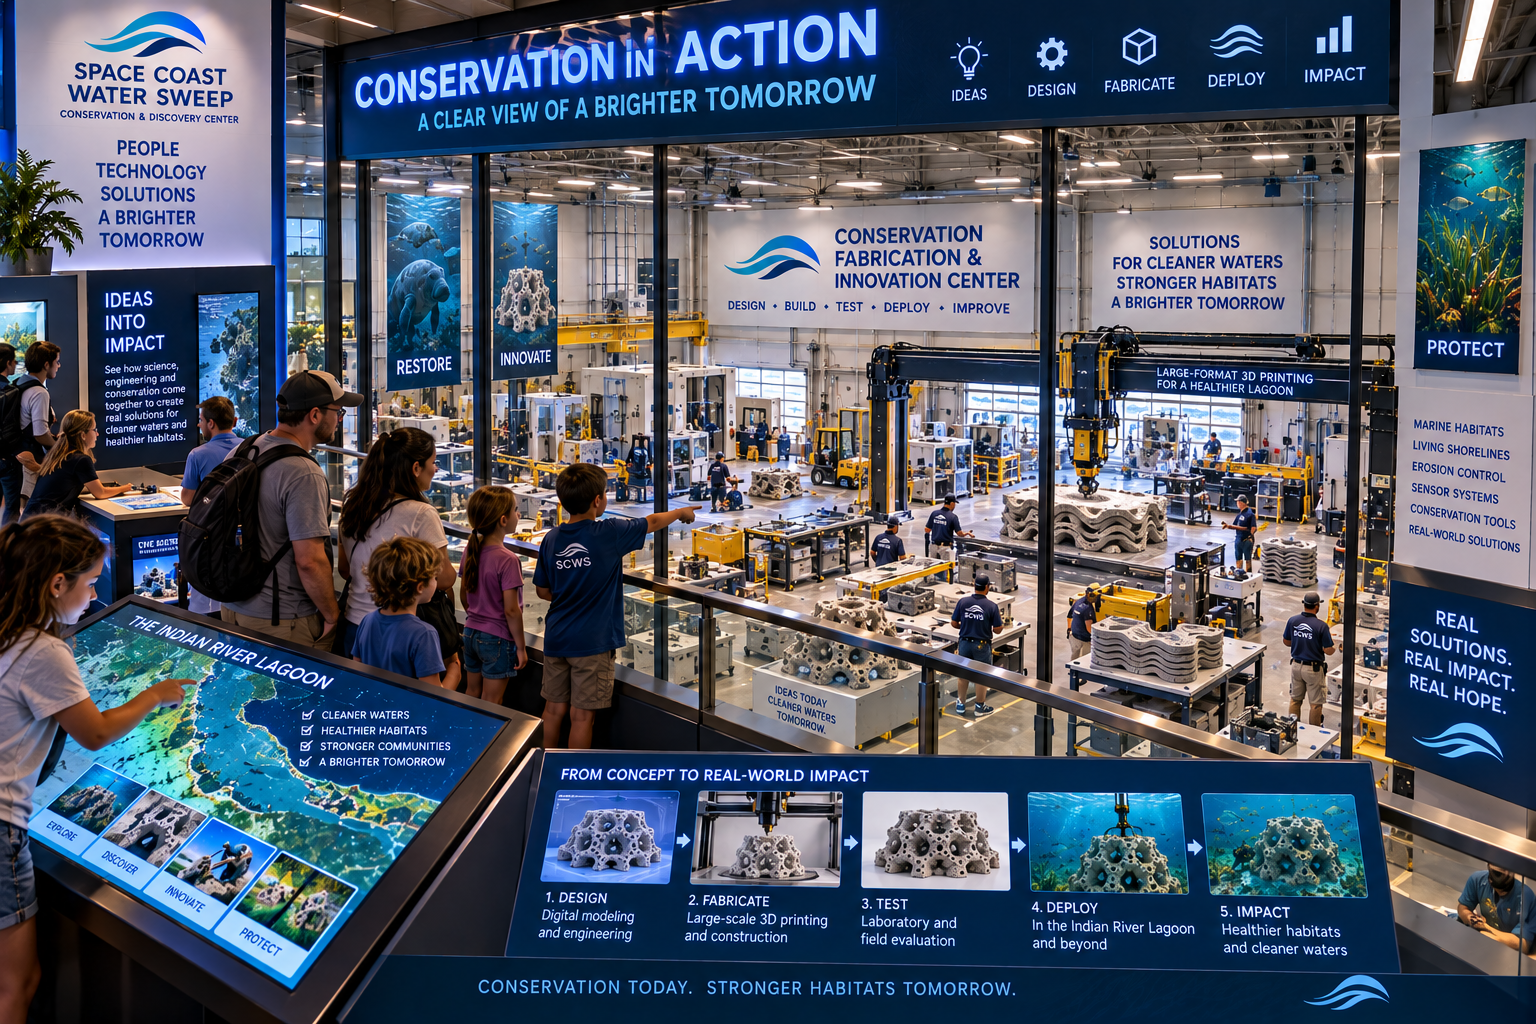
Glass-enclosed fabrication viewing gallery
Research observation windows
Live project displays
Prototype exhibits
Digital dashboards
Before / after results
Demonstrations
Student project showcases
“What Are We Building Today?” display
Conservation in Action exhibition hall titled 'Conservation in Action — A Clear View of a Brighter Tomorrow' showing an elevated gallery view of the Conservation Fabrication & Innovation Center, a foreground interactive kiosk 'From Concept to Real-World Impact' with a five-step process (Design — Digital modeling and engineering, Fabricate — Large-scale 3D printing and construction, Test — Laboratory and field evaluation, Deploy — In the Indian River Lagoon and beyond, Impact — Healthier habitats and cleaner waters), a left kiosk panel 'The Indian River Lagoon' with a checklist (Cleaner Waters, Healthier Habitats, Stronger Communities, A Brighter Tomorrow) and navigation buttons (Explore, Discover, Innovate, Protect), right-wall graphics listing Marine Habitats, Living Shorelines, Erosion Control, Sensor Systems, Conservation Tools, Real-World Solutions, and a footer 'Real Solutions. Real Impact. Real Hope.'
13 — SCALE

If Something Works, the Impact Shouldn't Have to Stop at One Test Site.

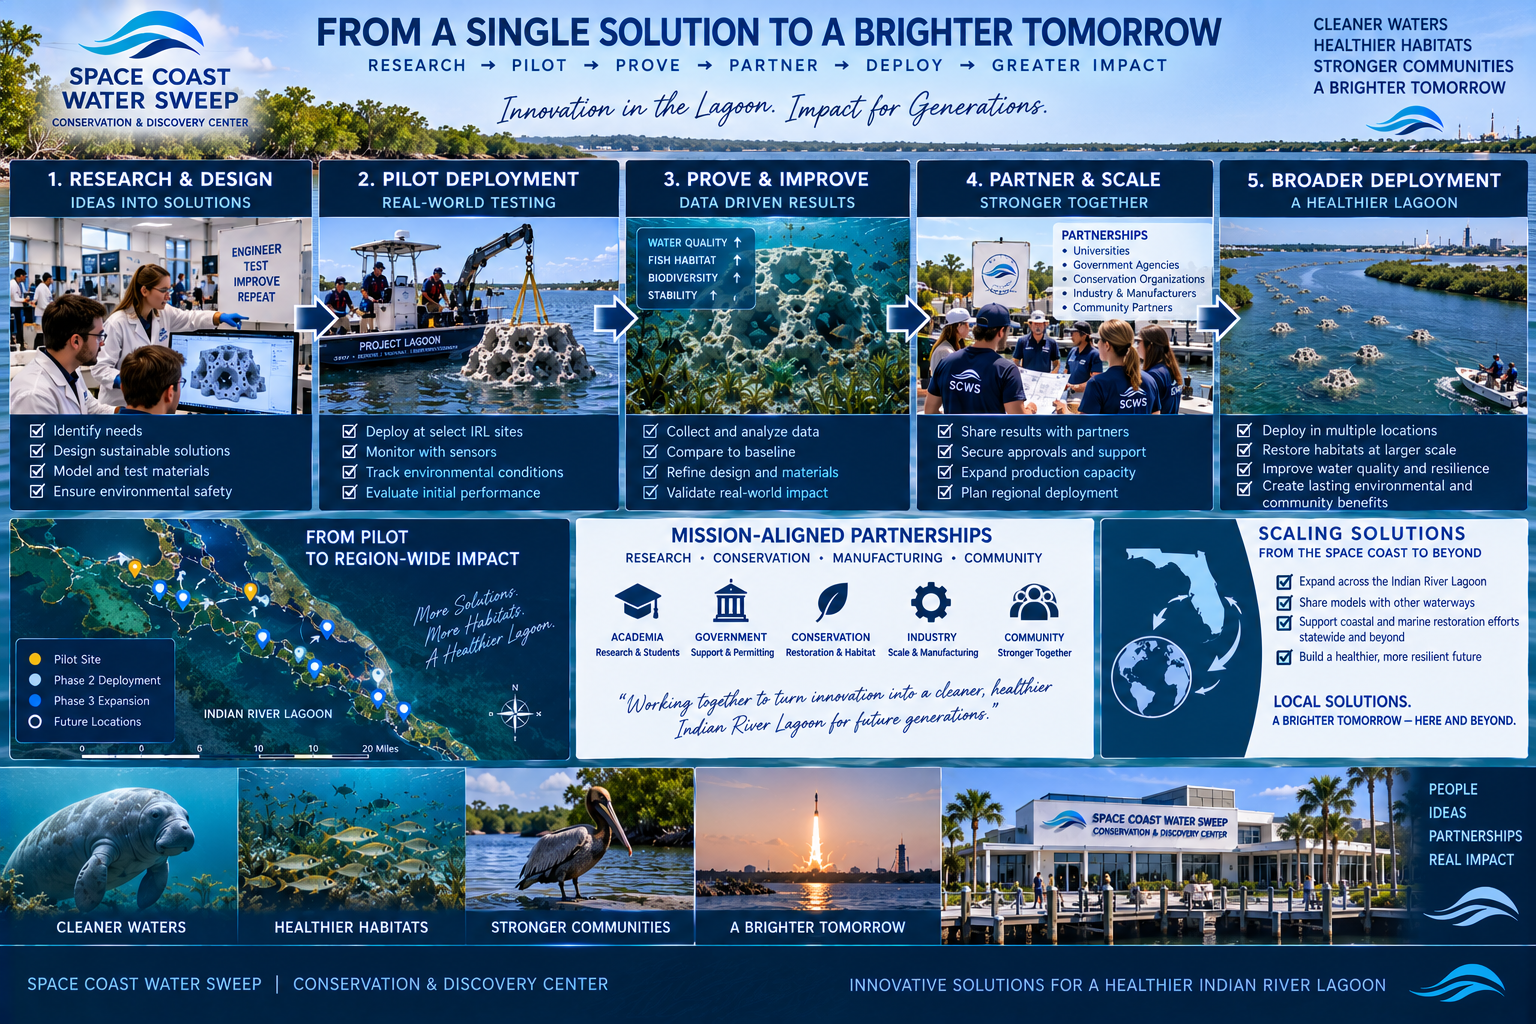
Successful, validated concepts may eventually have pathways to wider deployment. If SCWS develops original intellectual property, future licensing or mission-aligned manufacturing may be explored subject to nonprofit law, tax considerations, intellectual-property strategy, legal review, regulatory requirements, conflict-of-interest policies and board oversight.

Net resources generated through appropriate mission-aligned activity could support the nonprofit conservation mission. No revenue projections are made. Commercialization is not guaranteed.
Conservation partnerships
Government programs
Restoration organizations
Universities
Licensed manufacturing
Outside manufacturers
Technology partners
Sponsored deployment
Replication by other communities
From a Single Solution to a Brighter Tomorrow infographic titled 'From a Single Solution to a Brighter Tomorrow' with the path Research → Pilot → Prove → Partner → Deploy → Greater Impact, a five-stage process panel (Research & Design — Ideas into Solutions, Pilot Deployment — Real-World Testing, Prove & Improve — Data Driven Results, Partner & Scale — Stronger Together, Broader Deployment — A Healthier Lagoon) each with photos and checklists, a middle section with a 'From Pilot to Region-Wide Impact' Indian River Lagoon map (Pilot, Phase 2, Phase 3, Future markers), a 'Mission-Aligned Partnerships' block (Academia, Government, Conservation, Industry, Community), a 'Scaling Solutions — From the Space Coast to Beyond' block, and a bottom row of outcome images (Cleaner Waters — manatee, Healthier Habitats — fish school, Stronger Communities — pelican, A Brighter Tomorrow — rocket launch at sunset) alongside the Conservation & Discovery Center building.

From a Problem in the Water to a Solution in the Water.

The real power of the Center is connecting capabilities that are often separated: field operations, science, data, engineering, fabrication, education and real-world testing.

DISCOVER→RESEARCH→INVENT→BUILD→DEPLOY→MEASURE→RESTORE

THEN USE WHAT WE LEARN TO MAKE THE NEXT SOLUTION BETTER.
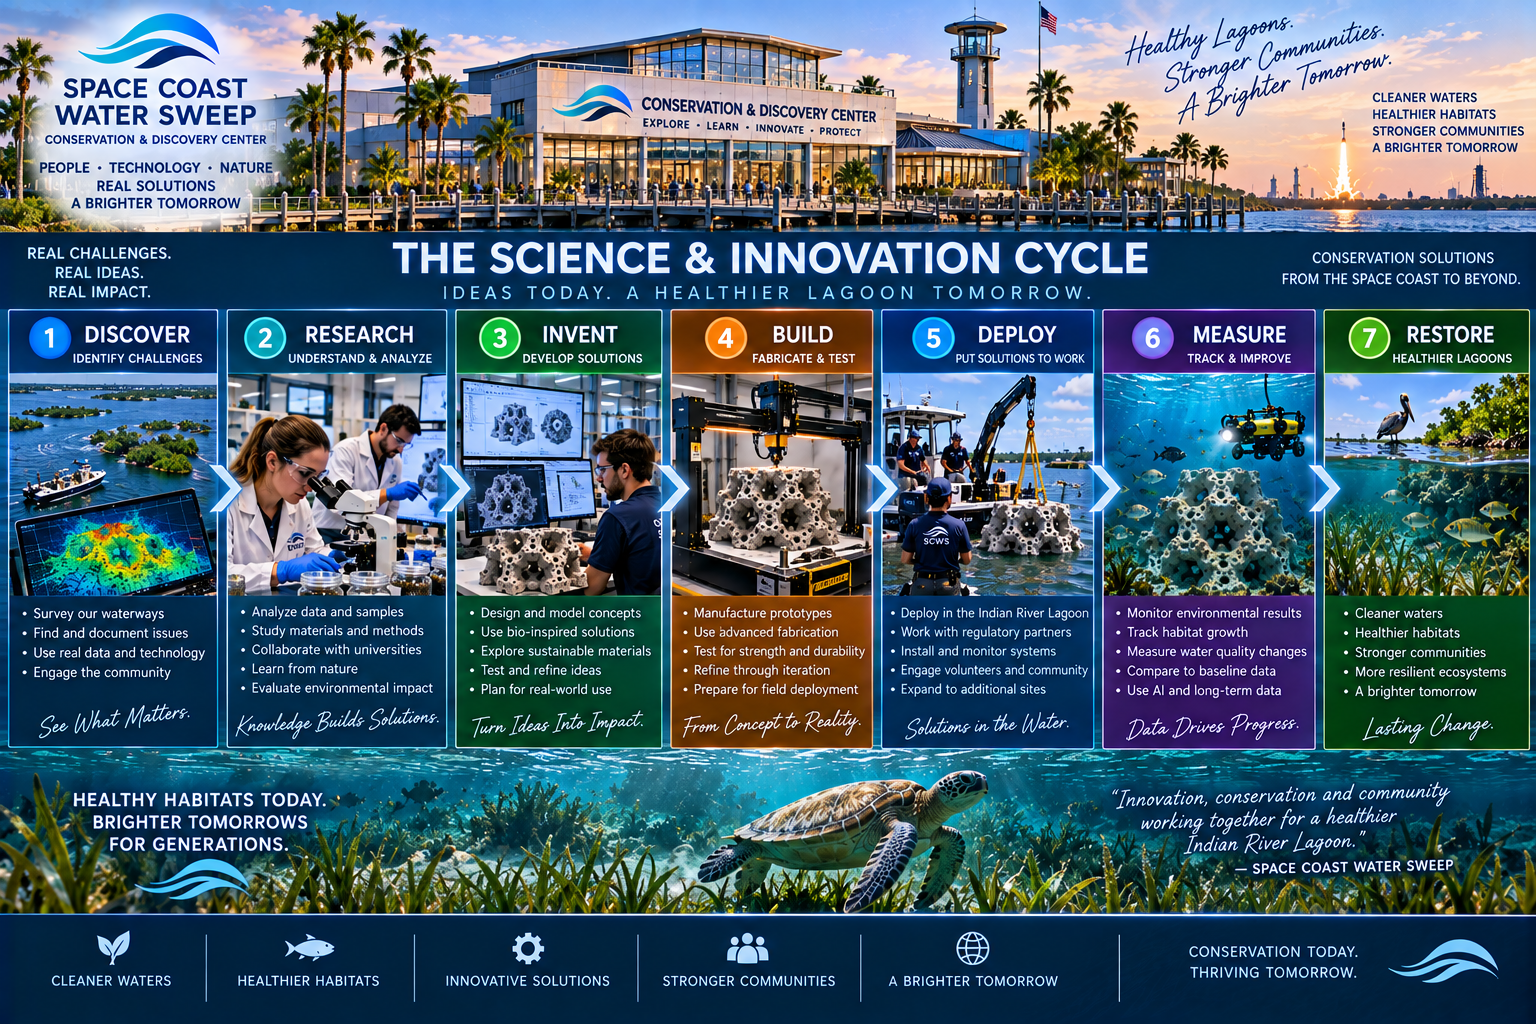
The Science & Innovation Cycle infographic titled 'The Science & Innovation Cycle — Ideas Today. A Healthier Lagoon Tomorrow.' with a seven-step process flow (Discover — Identify Challenges, Research — Understand & Analyze, Invent — Develop Solutions, Build — Fabricate & Test, Deploy — Put Solutions to Work, Measure — Track & Improve, Restore — Healthier Lagoons) each with a numbered circle, image and checklist, a header with the Conservation & Discovery Center and Space Coast Water Sweep branding and a footer with an underwater seagrass and sea turtle scene, outcome icons (Cleaner Waters, Healthier Habitats, Innovative Solutions, Stronger Communities, A Brighter Tomorrow) and the quote 'Innovation, conservation and community working together for a healthier Indian River Lagoon.'
LAGOON WATER TREATMENT & ENVIRONMENTAL ENGINEERING TESTBED

A Real-World Place Where New Water-Quality Solutions Can Be Developed, Tested and Demonstrated.

The Lagoon Water Treatment & Environmental Engineering Testbed is envisioned as a real-world environmental engineering research site where technologies that could improve estuarine water quality can be developed, tested, measured and demonstrated.

The Center is not claiming that one filtration system will clean the Indian River Lagoon. The Center is creating a place where new methods of improving lagoon water quality can be developed, tested, measured, demonstrated and — when successful — scaled into real-world solutions.
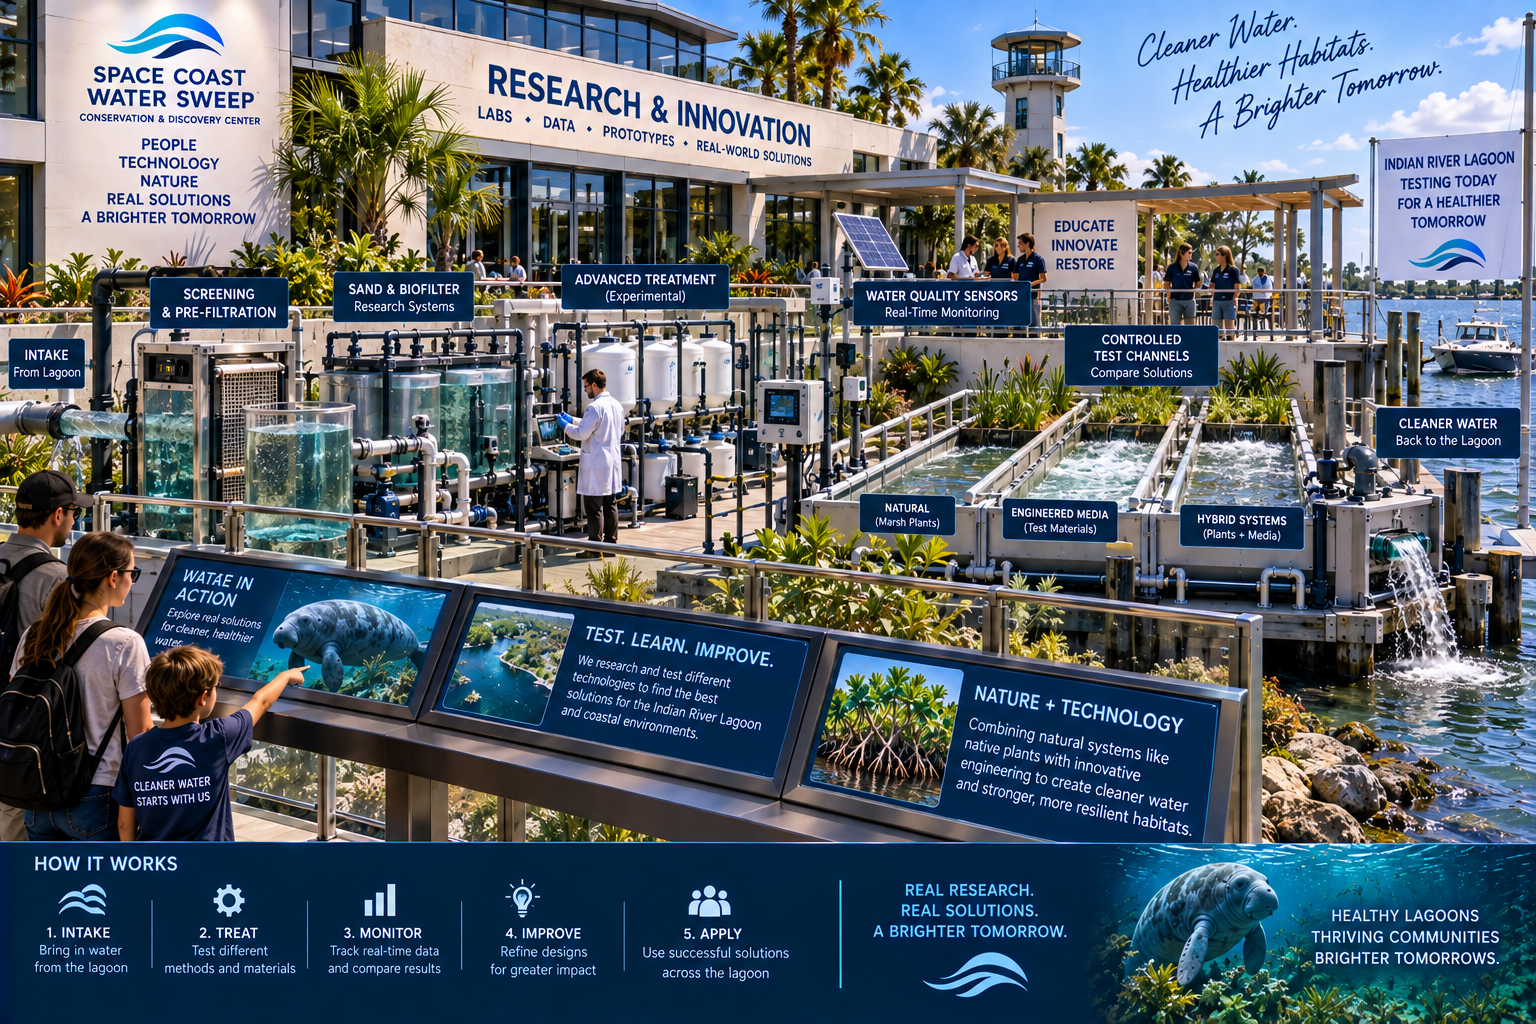
LAGOON WATER → BASELINE MEASUREMENT → EXPERIMENTAL TREATMENT → POST-TREATMENT MEASUREMENT → APPROPRIATE RETURN / MANAGEMENT
Modular treatment systems
Real-world waterfront testing
Connected to Research Lab and AI/Data Hub
Integrated with Conservation Fabrication & Innovation Center
Subject to all required permits and agency approvals
Research & Innovation infographic titled 'Research & Innovation — Labs ♦ Data ♦ Prototypes ♦ Real-World Solutions' overlaid on a waterfront testbed facility image with labeled equipment zones (Intake — From Lagoon, Screening & Pre-Filtration, Sand & Biofilter — Research Systems, Advanced Treatment — Experimental, Water Quality Sensors — Real-Time Monitoring, Controlled Test Channels — Compare Solutions, Natural — Marsh Plants, Engineered Media — Test Materials, Hybrid Systems — Plants + Media, Cleaner Water — Back to the Lagoon), three foreground interactive kiosks (Water in Action, Test. Learn. Improve., Nature + Technology) and a 'How It Works' footer with a five-step process (Intake — Bring in water from the lagoon, Treat — Test different methods and materials, Monitor — Track real-time data and compare results, Improve — Refine designs for greater impact, Apply — Use successful solutions across the lagoon).
LIVE WATER SCIENCE

See Incoming Water. See Treated Water. See the Difference.

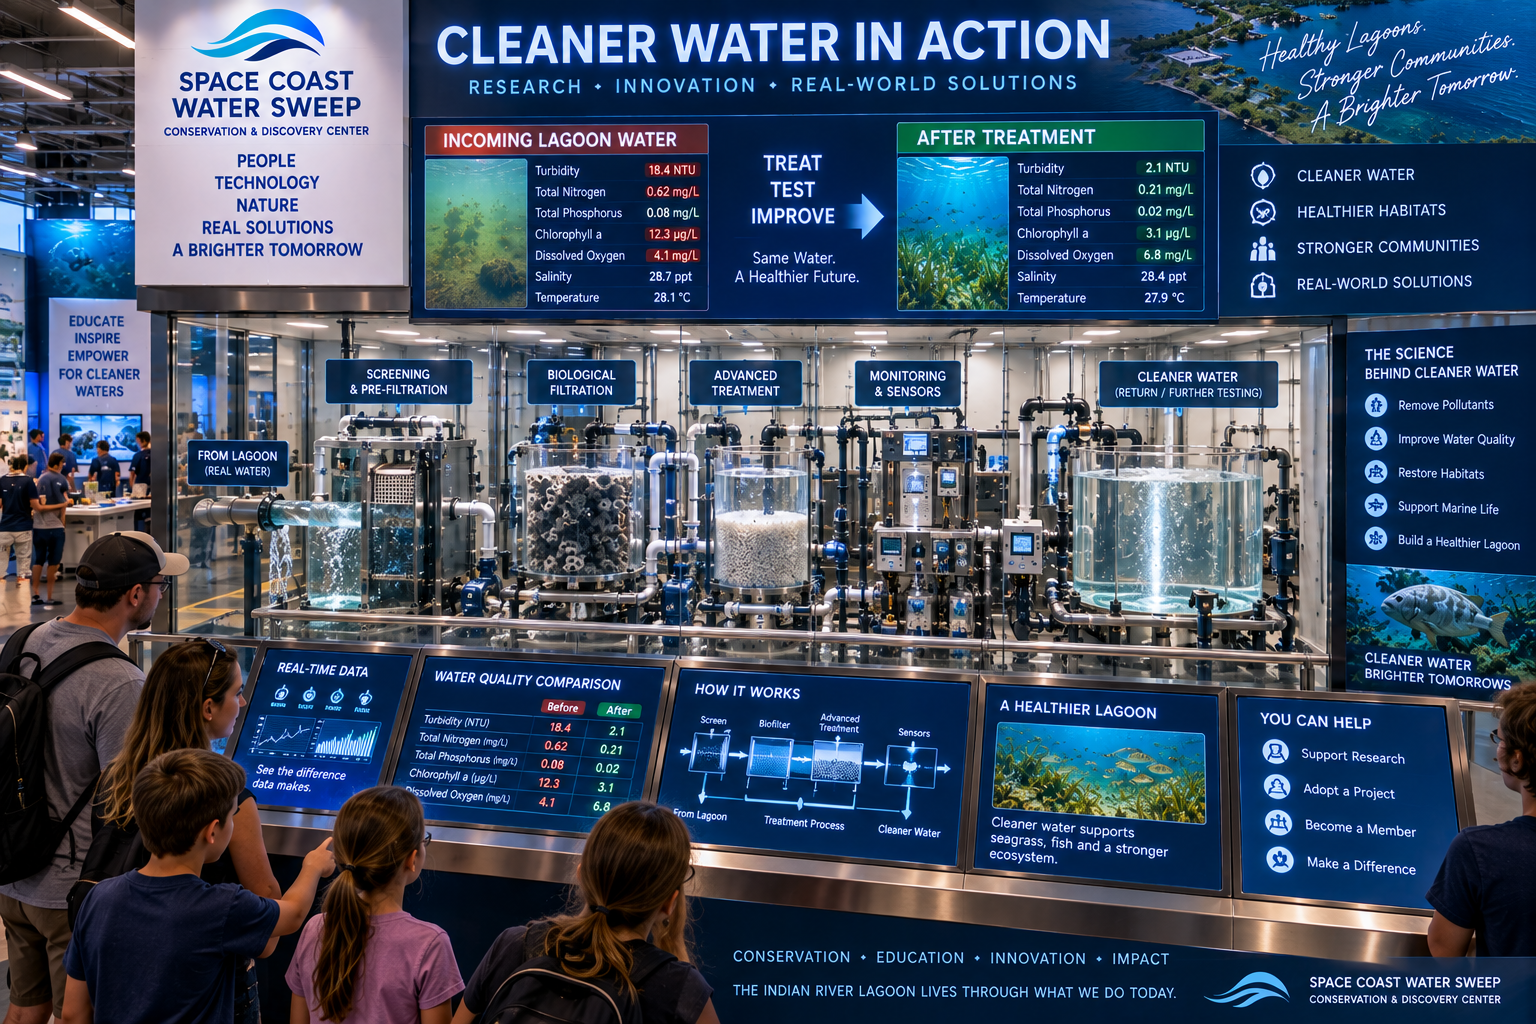
Connect the system to the Research Lab and AI/Data Hub. Where practical, allow visitors to see portions of the system and compare incoming water versus treated water through live digital exhibits.
Volume processed
Temperature
Salinity
Dissolved oxygen
pH
Turbidity
Nutrients where appropriate
Chlorophyll / algae indicators
Treatment efficiency
Energy consumption
Operating cost
Technology performance
Long-term environmental results
Cleaner Water in Action exhibit titled 'Cleaner Water in Action — Research ♦ Innovation ♦ Real-World Solutions' showing an Incoming Lagoon Water data panel (Turbidity 18.4 NTU, Total Nitrogen 0.62 mg/L, Total Phosphorus 0.08 mg/L, Chlorophyll a 12.3 μg/L, Dissolved Oxygen 4.1 mg/L, Salinity 28.7 ppt, Temperature 28.1 °C) beside an After Treatment panel (Turbidity 2.1 NTU, Total Nitrogen 0.21 mg/L, Total Phosphorus 0.02 mg/L, Chlorophyll a 3.1 μg/L, Dissolved Oxygen 6.8 mg/L, Salinity 28.4 ppt, Temperature 27.9 °C) with a 'Treat Test Improve — Same Water. A Healthier Future.' arrow between them, a five-stage transparent tank system (Screening & Pre-Filtration, Biological Filtration, Advanced Treatment, Monitoring & Sensors, Cleaner Water — Return / Further Testing), bottom consoles for Real-Time Data, Water Quality Comparison, How It Works, A Healthier Lagoon and You Can Help, and a sidebar 'The Science Behind Cleaner Water' listing Remove Pollutants, Improve Water Quality, Restore Habitats, Support Marine Life, Build a Healthier Lagoon.
BEFORE → IN → AFTER

Three Categories of Research.

Organize research around three connected intervention zones: preventing and treating impacts before water enters the lagoon, controlled treatment and research within lagoon conditions, and post-treatment return, reuse and monitoring.
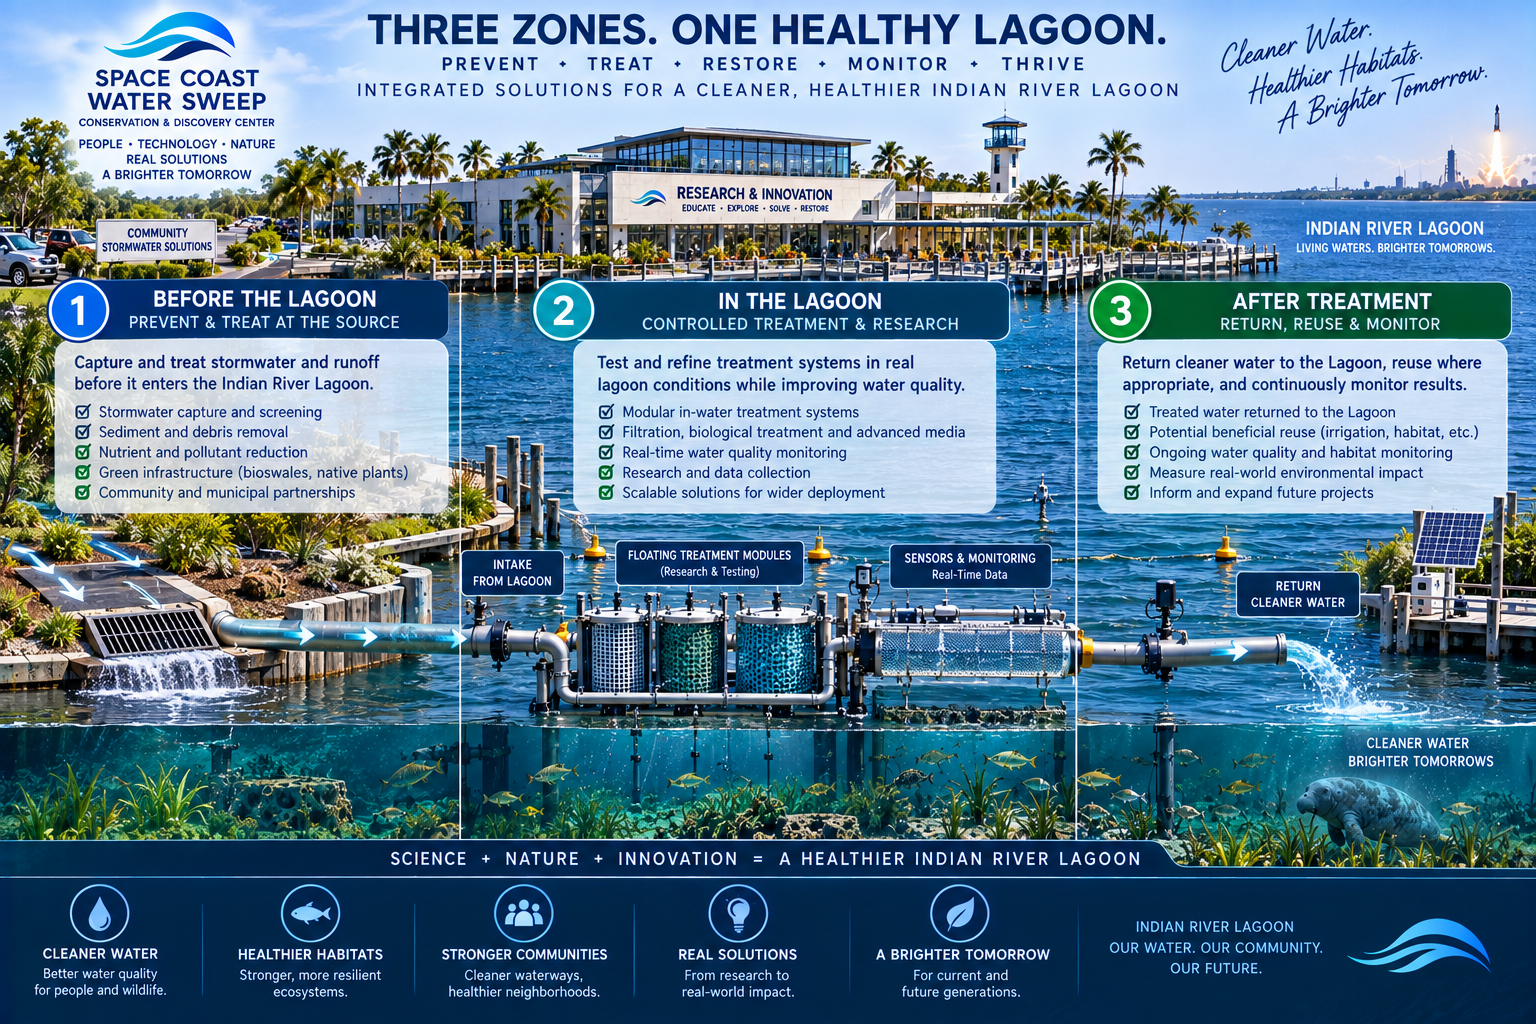
BEFORE THE LAGOON — stormwater, nutrient loading, freshwater discharges, treatment, source management
IN THE LAGOON — filtration, nutrient removal, oxygenation, circulation, biological treatment, microplastic capture
AFTER TREATMENT — safe water return, beneficial reuse, captured material management, energy efficiency, ecological response, scalability
Three Zones. One Healthy Lagoon. infographic titled 'Three Zones. One Healthy Lagoon. — Prevent + Treat + Restore + Monitor + Thrive — Integrated Solutions for a Cleaner, Healthier Indian River Lagoon' showing three numbered vertical panels: Zone 1 Before the Lagoon (Prevent & Treat at the Source — stormwater capture and screening, sediment and debris removal, nutrient and pollutant reduction, green infrastructure, community and municipal partnerships), Zone 2 In the Lagoon (Controlled Treatment & Research — modular in-water treatment systems, filtration/biological treatment/advanced media, real-time water quality monitoring, research and data collection, scalable solutions), Zone 3 After Treatment (Return, Reuse & Monitor — treated water returned to the Lagoon, beneficial reuse, ongoing water quality and habitat monitoring, measure real-world environmental impact, inform and expand future projects), a mid-section visual of treatment pipes and machinery across the lagoon labeled Intake from Lagoon, Floating Treatment Modules, Sensors & Monitoring, Return Cleaner Water, and a footer summary bar with five pillars (Cleaner Water, Healthier Habitats, Stronger Communities, Real Solutions, A Brighter Tomorrow) and the tagline 'Science + Nature + Innovation = a Healthier Indian River Lagoon.'

Potential Research Areas

The testbed is modular rather than permanently tied to one treatment method.

Biological filtration
Nutrient capture / removal
Aeration
Oxygenation
Fine-particle filtration
Microplastic capture
Specialized treatment media
Constructed wetland / biofilter concepts
Algae management
Water circulation
Emerging environmental technologies
FRESHWATER & SALINITY INNOVATION RESEARCH

Can Freshwater Discharges Be Managed to Reduce Ecological Impacts?

Include research into large freshwater inputs entering the Indian River Lagoon. The Center does not claim that adding salt is the solution.

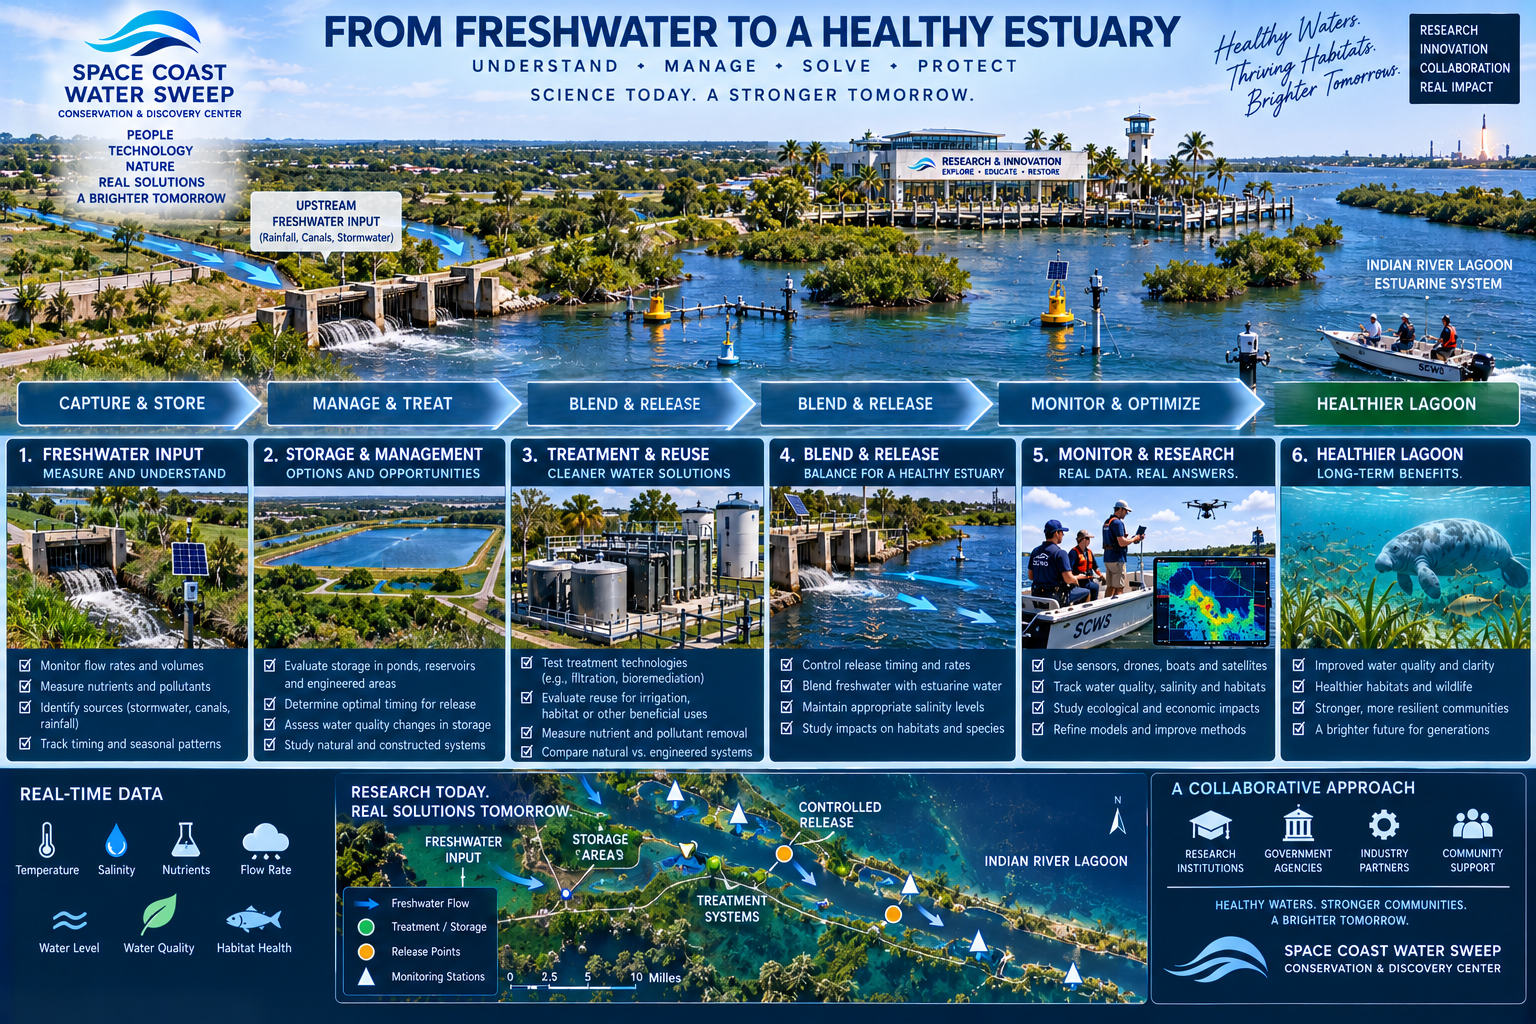
The research question: Can freshwater discharges be captured, reused, treated, stored, gradually released, blended, conditioned or otherwise managed to reduce ecological impacts associated with rapid salinity changes?
Capture
Reuse
Treatment
Storage
Gradual release
Blending
Conditioning
Other management approaches
From Freshwater to a Healthy Estuary infographic titled 'From Freshwater to a Healthy Estuary — Understand ✦ Manage ✦ Solve ✦ Protect — Science Today. A Stronger Tomorrow.' showing a six-step process flow (Capture & Store, Manage & Treat, Blend & Release, Blend & Release, Monitor & Optimize, Healthier Lagoon) with six columns: 1. Freshwater Input / Measure and Understand (monitor flow, measure nutrients, identify sources, track timing), 2. Storage & Management / Options and Opportunities (evaluate storage, determine timing, assess water quality, study systems), 3. Treatment & Reuse / Cleaner Water Solutions (test technologies, evaluate reuse, measure removal, compare systems), 4. Blend & Release / Balance for a Healthy Estuary (control release, blend water, maintain salinity, study impacts), 5. Monitor & Research / Real Data. Real Answers. (use sensors/drones, track water quality, study ecology, refine models), 6. Healthier Lagoon / Long-Term Benefits (improved water quality, healthier habitats, stronger communities, a brighter future), and a footer with real-time data icons (temperature, salinity, nutrients, flow rate, water level, water quality, habitat health), an Indian River Lagoon research map (freshwater flow, treatment/storage, release points, monitoring stations), and a collaborative approach across research institutions, government agencies, industry partners and community support.
MOBILE RESEARCH PLATFORM — FUTURE CAPABILITY

A Future Mobile Platform Could Take Treatment Research Into the Field.

A future mobile research concept could potentially use a dedicated vessel, pontoon, barge, trailer-based system or modular equipment. Permanent or temporary piping, remote treatment locations, larger pumping systems or distributed treatment infrastructure are described only as future possibilities requiring demonstrated benefit and appropriate authorization.
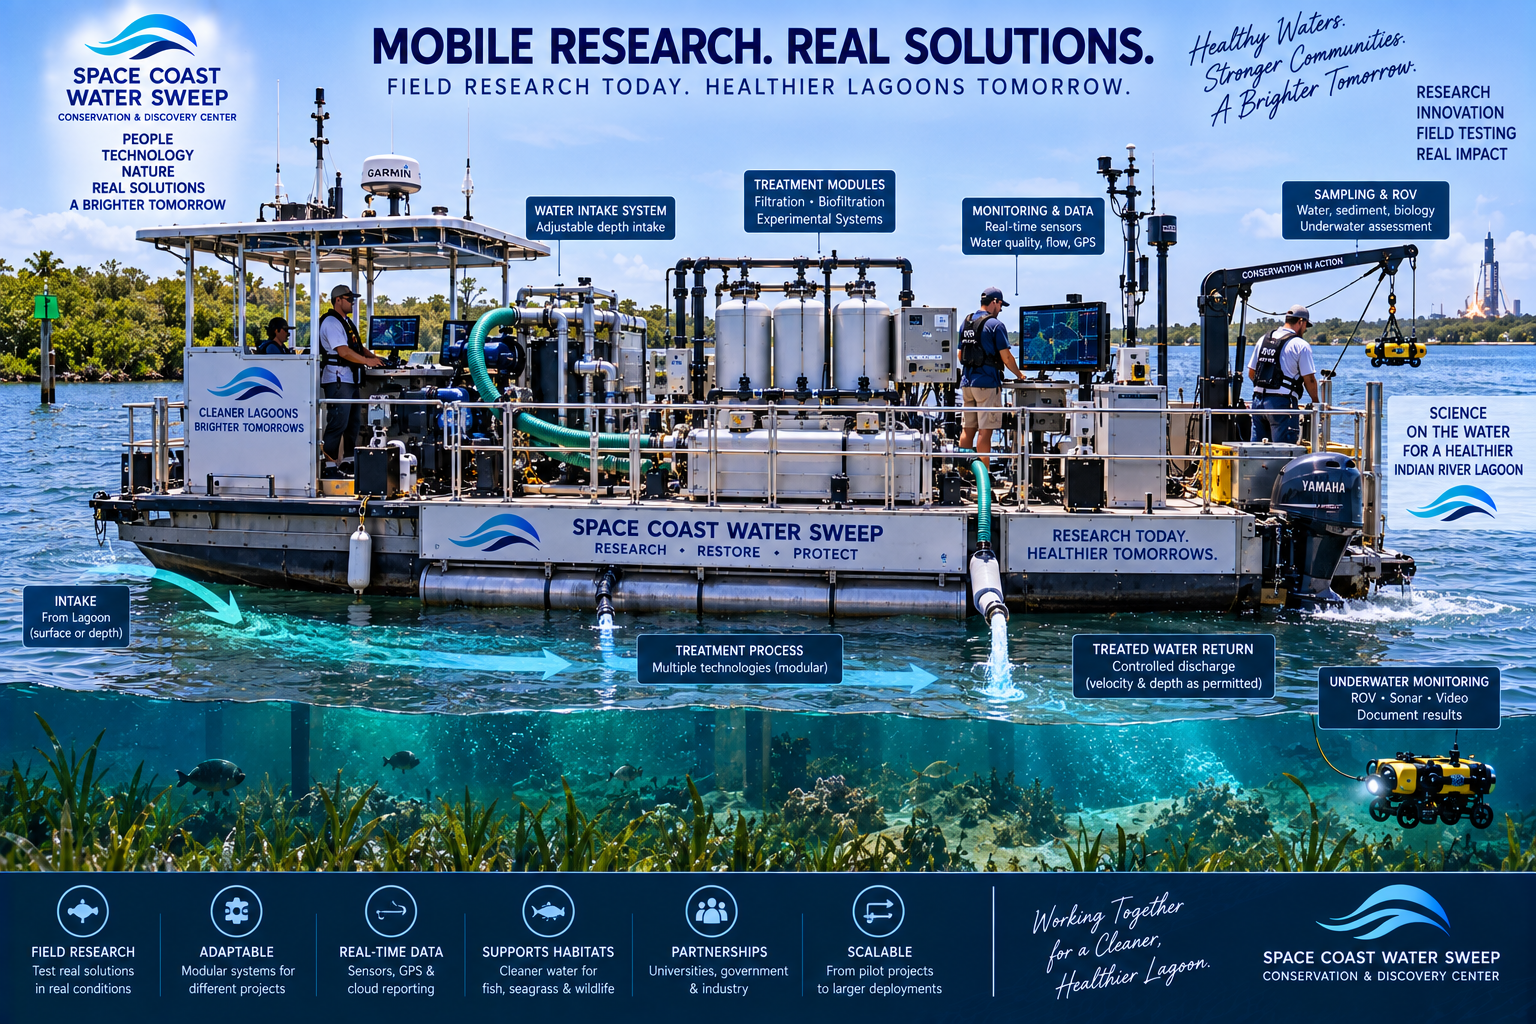
INTAKE → MEASURE BASELINE → APPLY TREATMENT → MEASURE TREATED WATER → APPROPRIATELY RETURN → GPS DOCUMENT → MONITOR AFTERWARD
Mobile Research. Real Solutions. infographic titled 'Mobile Research. Real Solutions. — Field Research Today. Healthier Lagoons Tomorrow.' showing a pontoon research barge on the lagoon with callouts to its equipment (Water Intake System — adjustable depth intake, Treatment Modules — filtration/biofiltration/experimental systems, Monitoring & Data — real-time sensors for water quality/flow/GPS, Sampling & ROV — water/sediment/biology and underwater assessment), a process flow along the boat (Intake — From Lagoon surface or depth, Treatment Process — multiple modular technologies, Treated Water Return — controlled discharge velocity and depth as permitted), an underwater scene with submerged aquatic vegetation and an ROV labeled Underwater Monitoring — ROV/Sonar/Video to document results, and a footer with six pillars (Field Research — test real solutions in real conditions, Adaptable — modular systems for different projects, Real-Time Data — sensors/GPS/cloud reporting, Supports Habitats — cleaner water for fish/seagrass/wildlife, Partnerships — universities/government/industry, Scalable — from pilot projects to larger deployments).
RESEARCH → FABRICATION → FIELD TESTING → AI

The Complete Development Cycle.

Connect this program directly to the Conservation Fabrication & Innovation Center. Show the complete development cycle from identifying a problem through scaling a successful solution.

IDENTIFY PROBLEM→DESIGN SOLUTION→PROTOTYPE→FABRICATE→LABORATORY TEST→WATERFRONT TEST→FIELD DEPLOY→MONITOR→ANALYZE WITH AI→IMPROVE→RETEST→SCALE

THE CENTER IS NOT CLAIMING THAT ONE FILTRATION SYSTEM WILL CLEAN THE INDIAN RIVER LAGOON.
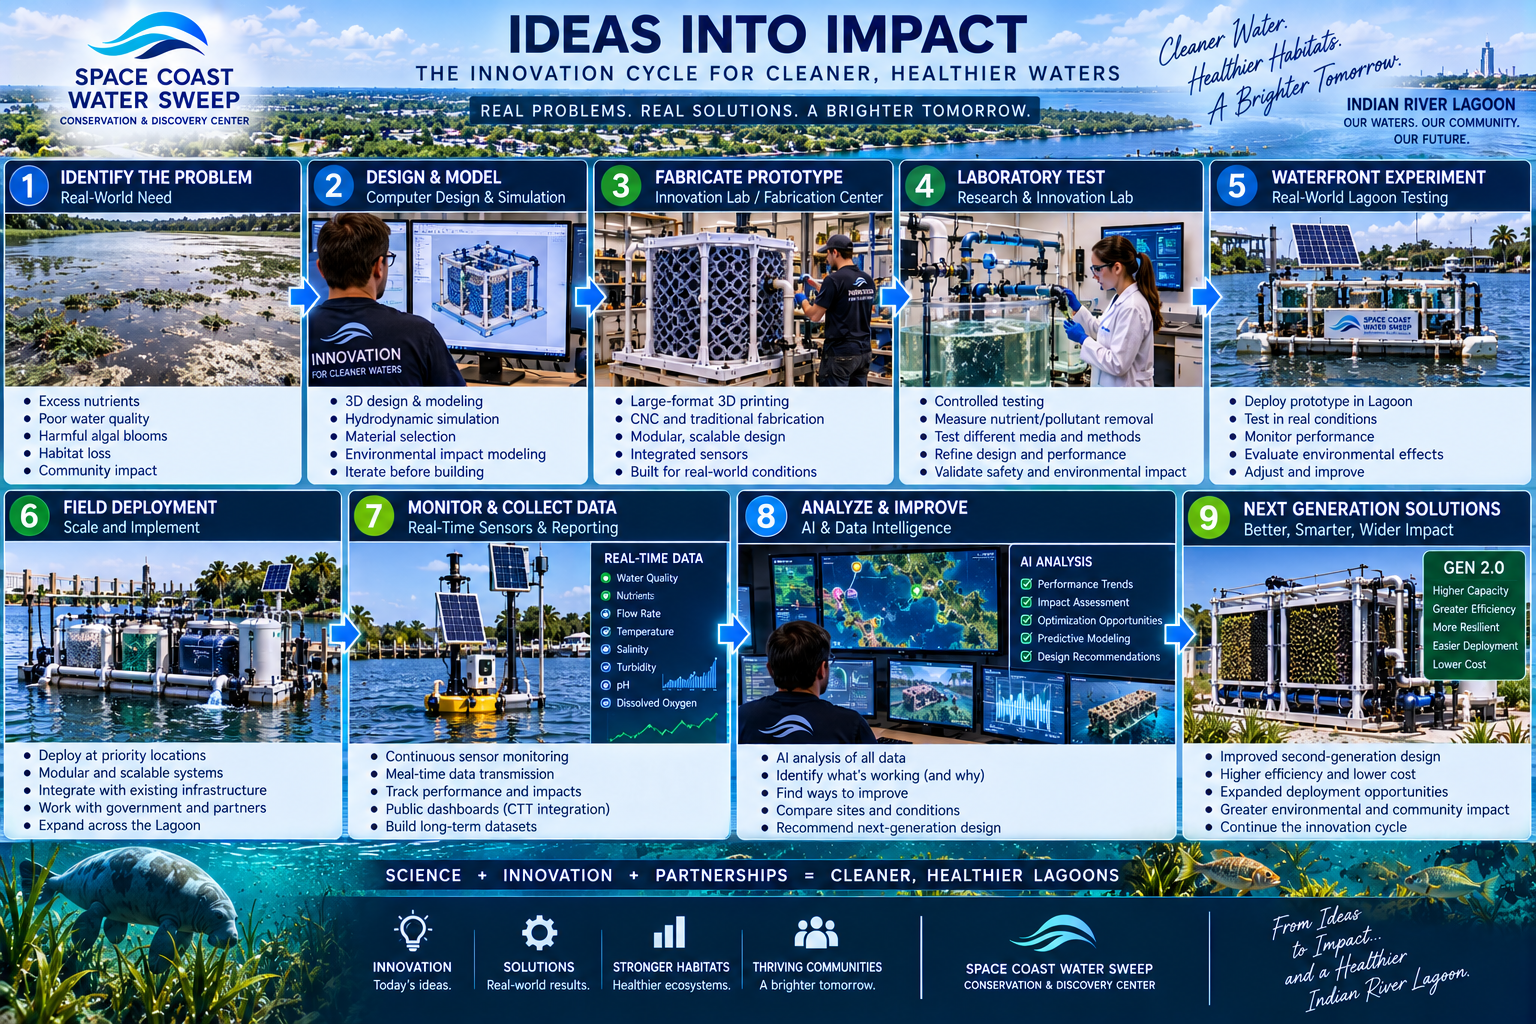
Ideas Into Impact infographic titled 'Ideas Into Impact — Cleaner Water. Healthier Habitats. A Brighter Tomorrow.' showing a nine-step innovation cycle: 1. Identify the Problem (excess nutrients, poor water quality, harmful algal blooms, habitat loss, community impact), 2. Design & Model (3D design and modeling, hydrodynamic simulation, material selection, environmental impact modeling, iterate before building), 3. Fabricate Prototype (large-format 3D printing, CNC and traditional fabrication, modular scalable design, integrated sensors, built for real-world conditions), 4. Laboratory Test (controlled testing, measure nutrient/pollutant removal, test different media and methods, refine design and performance, validate safety and environmental impact), 5. Waterfront Experiment (deploy prototype in Lagoon, test in real conditions, monitor performance, evaluate environmental effects, adjust and improve), 6. Field Deployment (deploy at priority locations, modular and scalable systems, integrate with existing infrastructure, work with government and partners, expand across the Lagoon), 7. Monitor & Collect Data (real-time sensors — water quality, nutrients, flow rate, temperature, salinity, turbidity, pH, dissolved oxygen; continuous sensor monitoring, real-time data transmission, track performance and impacts, public dashboards with CTT integration, build long-term datasets), 8. Analyze & Improve (AI analysis — performance trends, impact assessment, optimization opportunities, predictive modeling, design recommendations; identify what's working and why, find ways to improve, compare sites and conditions, recommend next-generation design), 9. Next Generation Solutions (Gen 2.0 — higher capacity, greater efficiency, more resilient, easier deployment, lower cost; improved second-generation design, higher efficiency and lower cost, expanded deployment opportunities, greater environmental and community impact, continue the innovation cycle), with a footer of four pillars (Innovation — today's ideas, Solutions — real-world results, Stronger Habitats — healthier ecosystems, Thriving Communities — a brighter tomorrow) and the tagline 'Science + Innovation + Partnerships = Cleaner, Healthier Lagoons.'
EDUCATION & PUBLIC EXPERIENCE

Where practical, visitors should be able to see real lagoon water entering an experimental system and view appropriate portions of treatment and measurement.

Students and researchers could investigate treatment effectiveness, energy requirements, operating cost, environmental effects and scalability.

THE CENTER AS A RESEARCH ENVIRONMENT

The Center Itself Becomes a Living Laboratory.

The campus should not simply teach other people how to protect water while becoming part of the problem itself. Every reasonable effort should be made to reduce the campus's own environmental impact, measure what works and use the property as a real-world learning environment — connecting grounds, infrastructure and operations to the research mission.

Campus Water Use & Rainfall

Campus water use, rainfall and runoff are measured and studied — not merely managed. Rain gardens, bioswales and permeable surfaces become real research sites.

Rainwater Capture & Treatment

Rainwater capture and reuse are explored where feasible. Treatment systems and wash-down water management provide real data on what works in a Florida coastal environment.

NatureScape & Living Shoreline Monitoring

NatureScape native landscaping and living shoreline demonstrations are monitored for habitat performance, runoff reduction and ecological response — connecting grounds management to conservation research.

Campus Energy Generation & Use

Solar field or solar canopies, efficient building systems, battery and storage possibilities and campus energy monitoring provide data on renewable energy performance in a coastal climate.

Electric Mobility & Charging

Electric campus mobility and charging infrastructure provide data on fleet energy use, operational patterns and the practical realities of electric transportation in a working conservation campus.

AI/Data Hub Environmental Monitoring

The Center's AI and data infrastructure may eventually help monitor campus energy generation, consumption, water use, captured and reused water, runoff systems, treatment systems and overall environmental performance — turning the campus itself into a research dataset.

REDUCE OUR OWN IMPACT→MEASURE IT→LEARN FROM IT→DEVELOP BETTER SYSTEMS→TEST THEM→HELP ELSEWHERE

The campus is not claimed to be net-zero or fully solar powered unless future engineering demonstrates that. No environmental performance results are claimed that do not yet exist. Campus runoff routing to another watershed requires future property-specific engineering, hydrology, drainage and regulatory review.

CONCEPTUAL VISION

Renderings, site layouts, amenities, facilities, costs, locations, timelines and proposed features shown within the Conservation & Discovery Center vision are conceptual and subject to feasibility studies, funding, partnerships, property availability, permitting, engineering and final design.

CENTER
BACK